Graphing Polynomial Functions
Graphing Polynomial Functions. Goal: Evaluate and graph polynomial functions. CCSS: F.IF.4.

Graphing Polynomial Functions
E N D
Presentation Transcript
Graphing Polynomial Functions Goal: Evaluate and graph polynomial functions.
CCSS: F.IF.4 • Given a function, identify key features in graphs and tables including: intercepts; intervals where the function is increasing, decreasing, positive, or negative; relative maximums and minimums; symmetries; end behavior; and periodicity.
Standards for Mathematical Practice • 1. Make sense of problems and persevere in solving them. • 2.Reason abstractly and quantitatively. • 3. Construct viable arguments and critique the reasoning of others. • 4. Model with mathematics. • 5. Use appropriate tools strategically. • 6.Attend to precision. • 7. Look for and make use of structure. • 8.Look for and express regularity in repeated reasoning.
Essential Question: • How do I graph a polynomial function?
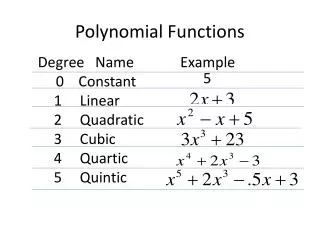
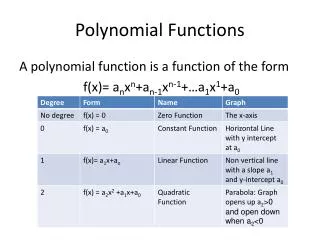
Polynomial Function • Function of the form: • an is the leading coefficient • a0 is the constant term • n is the degree • Polynomial is in standard form if its terms are written in descending order of exponents from left to right.
EVALUATING POLYNOMIAL FUNCTIONS an n n n– 1 a0 an 0 leading coefficient an constant term degree a0 n descending order of exponents from left to right. A polynomial function is a function of the form f(x) = an xn+ an– 1xn– 1+· · ·+ a1x + a0 Where an 0 and the exponents are all whole numbers. For this polynomial function, an is the leading coefficient, a0 is the constant term, and nis the degree. A polynomial function is in standard form if its terms are written in descending order of exponents from left to right.
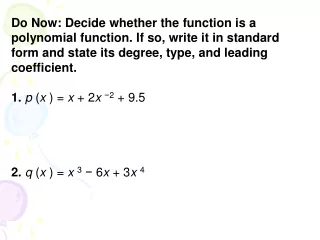
Identifying Polynomial Functions Decide whether the function is a polynomial function. If it is, write the function in Standard form and state its degree, type, and leading coefficient.
Identifying Polynomial Functions Decide whether the function is a polynomial function. If it is, write the function in Standard form and state its degree, type, and leading coefficient.
Evaluate the Polynomial FunctionUsing Synthetic Substitution
Evaluating a Polynomial Function in Real Life The time t (in seconds) it takes a camera battery to recharge after flashing n times can be modeled by: Find the recharge time after 100 flashes.
6.2 Continued: Graphing Polynomial Functions Will use end behavior to analyze the graphs of polynomial functions.
End Behavior • Behavior of the graph as x approaches positive infinity (+∞) or negative infinity (-∞) • The expression x→+∞ : as x approaches positive infinity • The expression x→-∞ : as x approaches negative infinity
End Behavior of Graphs of Linear Equations f(x) = x f(x) = -x f(x)→-∞ as x→+∞ f(x)→+∞ as x→-∞ f(x)→+∞ as x→+∞ f(x)→-∞ as x→-∞
End Behavior of Graphs of Quadratic Equations f(x) = x² f(x) = -x² f(x)→-∞ as x→+∞ f(x)→-∞ as x→-∞ f(x)→+∞ as x→+∞ f(x)→+∞ as x→-∞
Investigating Graphs of Polynomial Functions • Use a Graphing Calculator to grph each function then analyze the functions end behavior by filling in this statement: f(x)→__∞ as x→+∞ and f(x)→__∞ as x→-∞ a. f(x) = x³ c. f(x) = x4 e. f(x) = x5 g. f(x) = x6 b. f(x) = -x³ d. f(x) = -x4 f. f(x) = -x5 h. f(x) = -x6
Investigating Graphs of Polynomial Functions • How does the sign of the leading coefficient affect the behavior of the polynomial function graph as x→+∞? • How is the behavior of a polynomial functions graph as x→+∞ related to its behavior as x→-∞ when the functions degree is odd? When it is even?
End Behavior for Polynomial Functions For the graph of • If an>0 and n even, then f(x)→+∞ as x→+∞ and f(x)→+∞ as x→-∞ • If an>0 and n odd, then f(x)→+∞ as x→+∞ and f(x)→-∞ as x→-∞ • If an<0 and n even, then f(x)→-∞ as x→+∞ and f(x)→-∞ as x→-∞ • If an<0 and n odd, then f(x)→-∞ as x→+∞ and f(x)→+∞ as x→-∞
Graphing Polynomial Functions f(x)= x³ + x² – 4x – 1
Graphing Polynomial Functions f(x)= -x4 –2x³ + 2x² + 4x