FLORIDA’S NONPROFIT SECTOR:
280 likes | 586 Views
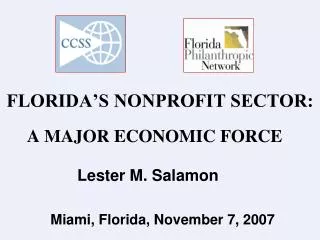
FLORIDA’S NONPROFIT SECTOR:. A MAJOR ECONOMIC FORCE. Lester M. Salamon. Miami, Florida, November 7, 2007. The Johns Hopkins Center for Civil Society Studies. FLORIDA REALITIES. • 4 th most populous state. • Twice the U.S. population growth rate, 2000-04.

FLORIDA’S NONPROFIT SECTOR:
E N D
Presentation Transcript
FLORIDA’S NONPROFIT SECTOR: A MAJOR ECONOMIC FORCE Lester M. Salamon Miami, Florida, November 7, 2007
The Johns Hopkins Center for Civil Society Studies FLORIDA REALITIES • 4th most populous state • Twice the U.S. population growth rate, 2000-04 • 25% larger proportion of elderly than U.S. • Median household income 10% below U.S. • 21% of residents with no health insurance vs. 16% nationally
Tax Code Number Type of Tax-exempt Org TYPES OF TAX-EXEMPT ORGS UNDER U.S. LAW 501(c)(1) Corporations organized under an act of Congress 501(c)(2) Title-holding companies 501(c)(3) Religious, charitable, educational, etc. 501(c)(4) Social Welfare 501(c)(5) Labor, agriculture organization 501(c)(6) Business leagues 501(c)(7) Social and recreational clubs 501(c)(8) Fraternal beneficiary societies 501(c)(9) Voluntary employees’ beneficiary societies 501(c)(10) Domestic fraternal beneficiary societies 501(c)(11) Teacher’s retirement fund 501(c)(12) Benevolent life insurance associations 501(c)(13) Cemetery companies 501(c)(14) Credit unions 501(c)(15) Mutual insurance companies 501(c)(16) Corporations to finance crop operation 501(c)(17) Supplement unemployment benefit trusts 501(c)(18) Employee-funded pension trusts 501(c)(19) War veterans’ organizations 501(c)(20) Legal services organizations 501(c)(21) Black lung trusts 501(c)(25) Holding companies for pensions 501(d) Religious and apostolic organizations 501(e) Cooperative hospital service organizations 501(f) Cooperative service organizations of operation educational organizations 521 Farmer’s cooperatives 527 Political organizations
The Johns Hopkins Center for Civil Society Studies IN SEARCH OF FLORIDA NONPROFITS 501 (C) (3)’s 46,587 organizations EOMF: IRS 990 filers: ES-202: 13,686 organizations 6,192 organizations
A MAJOR ECONOMIC PRESENCE – 2005 The Johns Hopkins Center for Civil Society Studies • 630,000 workers – 380,000 paid workers – 250,000 FTE volunteer workers • 4.9% of total state employment • $48.1 billion in revenues • $76.2 billion of assets • $14.6 billion in wages and compensation • Generates at least $300 million of sales tax revenue
981 Retail 814 Administrative Support 728 Accommodations & Food Nonprofit Sector 597 Health & Social Services* Nonprofit employees Nonprofit volunteers 574 Construction 487 Education* Professional & Scientific Services* 422 400 Manufacturing 352 Finance & Insurance 338 Wholesale 259 Transport 216 Other Services* 173 Real Estate 168 Information 167 Arts & recreation 101 Agriculture 63 Management of Companies 30 Utilities 6 The Johns Hopkins Center for Civil Society Studies Florida Nonprofits: The 4th Largest Workforce Among Florida Industries 380 629 Other Employees Mining 0 200 400 600 800 1000 1200 * Excludes nonprofits % of nonprofit revenue
The Johns Hopkins Center for Civil Society Studies FLORIDA NONPROFIT EMPLOYMENT BELOW U.S. AVERAGE 14% 13.3% 12% 10% 8.0% 8% 7.2% Nonprofit Employment as % of Total 6.3% 6% 5.1% 4.9% 4.1% 4% 2% 0% U.S. Ohio Texas Florida California New York Census Dist. 5 Southeast
The Johns Hopkins Center for Civil Society Studies FLORIDA NONPROFIT EXPENDITURES PER $1,000 OF GROSS STATE PRODUCT BELOW U.S. AVERAGE* $140 $127 $120 $117 $93 $100 $87 $87 $80 $73 Nonprofit Expenditures per $1000 of GSP $60 $52 $40 $20 $0 U.S. Ohio Florida Texas California Southeast New York *2005 990 data/2004 Gross State Product
The Johns Hopkins Center for Civil Society Studies FLORIDA NONPROFIT EXPENDITURES PER CAPITA BELOW U.S. AVERAGE $8000 $5939 $6000 $4322 $4000 Nonprofit Expenditures per Capita $3660 $3659 $3307 $2505 $2067 $2000 0% U.S. Ohio Texas Florida California Southeast New York
Organizations Expenditures II. A DIVERSE SECTOR: FIELDS The Johns Hopkins Center for Civil Society Studies 20% Arts, culture, recreation 3% 18% Youth, human srvcs, food, shelter 10% 14% Grant making & giving 5% 10% Civic and social 1% 8% Other civic 1% 7% Other education 4% 5% Social advocacy 4% 5% Not elsewhere classified 2% 5% 7% Other health 4% Nursing homes 6% 3% Science and tech 1% 1% Hospitals 47% 1% 8% Higher education 0% 10% 20% 40% 30% 50% % of State Nonprofit Total
The Johns Hopkins Center for Civil Society Studies DISTRIBUTION OF NONPROFIT EXPENDITURES BY FIELD, FLORIDA VS. THE NATION, 2005 80% Florida 70% United States* 60% 50% 47% 43% % of Total Nonprofit Expenditures 40% 30% 20% 10% 10% 9% 8% 8% 10% 7% 7% 6% 5% 4% 4% 4% 3% 3% 3% 3% 3% 3% 2% 2% 1% 1% 1% 1% 0% Higher education Nursing homes Civic and social organizations Hospitals Other education Social advocacy organizations Youth,human srvcs, food, shelter Grantmaking and giving services Other health Arts, entertainment, recreation Science and technology Not elsewhere classified Home health
Florida U.S. The Johns Hopkins Center for Civil Society Studies NONPROFIT SHARE OF TOTAL EMPLOYMENT IN SELECTED FIELDS, FLORIDA VS. U.S., 2005 5% Total 7% 73% Grantmaking and giving 85% 70% Social advocacy organizations 81% 68% Civic and social organizations 63% 52% Hospitals 60% 48% Youth development, human Services, food, and shelter 53% 36% Higher education 26% 28% Nursing homes 34% 22% Home health 18% 10% Other health 15% 5% Arts, culture, humanities, and recreation 10% 4% Other education 6% 1% Science and technology 3% 0% 20% 40% 60% 80% 100% Employment in nonprofits as percent of total employment
Share of FL NP employees NP employees as % of all employees DIVERSITY:GEOGRAPHIC DISTRIBUTION The Johns Hopkins Center for Civil Society Studies 29% Southeast 4.5% 25% Tampa Bay 5.5% 22% East Central 5.7% 10% Northeast 6.1% 6% Northwest 4.6% 4% North Central 7.9% 3% Southwest 3.3% 1% South Central 4.6% 4.9% State total 0% 10% 20% 30% 40% % of State Total
The Johns Hopkins Center for Civil Society Studies DISTRIBUTION OF FLORIDA NONPROFIT EMPLOYMENT, BY REGION, 2005
The Johns Hopkins Center for Civil Society Studies NONPROFIT EMPLOYMENT AS A PERCENT OF TOTAL EMPLOYMENT, BY REGION, 2005
Organizations Expenditures A DIVERSE SECTOR: ORGANIZATIONAL SIZE The Johns Hopkins Center for Civil Society Studies 80% SMALL (< $1 million) 4.3% 15% MEDIUM (Rev. $1 m - $9.9m) 14.3% 3% LARGE (Rev. $10 m - $49.9m) 18.3% 1% VERY LARGE (Rev. > $50m) 62.9% 0% 10% 20% 30% 40% 50% 60% 70% 80% 90% % of Florida Nonprofit Total
The Johns Hopkins Center for Civil Society Studies GENEROSITY: CHARITABLE GIVING% OF INCOME FROM CONTRIBUTIONS* 21.7% U.S. 25.3% Florida 91% Social advocacy 65% Civic and social Youth, human srvcs, food, shelter 60% 60% Grantmaking & giving 51% Science and technology 41% Not elsewhere classified Arts, culture, humanities and recreation 38% 36% Other education 32% Other health 22% Higher education 8% Nursing homes 4% Hospitals 0% 10% 20% 30% 40% 50% 60% 70% 80% 90% 100% % of nonprofit revenue * Includes private gifts and government grants
The Johns Hopkins Center for Civil Society Studies GENEROSITY II:FLORIDA BELOW U.S. AVERAGE IN CONTRIBUTIONS PER $1000 OF INCOME* $30 $28.99 $25.19 $24.66 $23.55 $23.47 $20 Contributions per $1000 of AGI* $20.73 $10 $0 U.S. Ohio Florida Texas California New York *AGI: Adjusted Gross Income
The Johns Hopkins Center for Civil Society Studies GENEROSITY III: VOLUNTEERING, 2006 40% 30.2% 30% 26.7% 26.6% 23.7% 23.5% 20% 18.6% 18.4% % of population volunteering 10% 0% U.S. Ohio Texas Florida California New York Southeast
The Johns Hopkins Center for Civil Society Studies FLORIDA NONPROFIT EXPENDITURES, GROWING FASTER THAN U.S. AVERAGE, 1992-2005 Florida 97% 70% U.S. 54% U.S. GDP California 190% Texas 84% 82% The South 70% Ohio 13% New York 0% 25% 75% 125% 175% 50% 100% 150% 200% Percent change in Expenditures, 1992-2005 (Adjusted for inflation)
7.2% Florida nonprofits U.S. nonprofits 6.8 Florida gross state product 5.6 U.S. GDP 4.4% 4.1% 4.0 3.7 3.7 3.5 3.1 2.9 1.9 The Johns Hopkins Center for Civil Society Studies Annual Average Change, Florida and U.S. NonprofitExpenditures and Florida and U.S. GDP,1992-2005, by Period 8% 7% 6% 5% 4% Annual Average % Change 3% 2% 1% 0% 1992-1997 1997-2002 2002-2005
Florida U.S. The Johns Hopkins Center for Civil Society Studies GROWTH IN NONPROFIT EXPENDITURES, BY FIELD, FLORIDA VS. U.S. 97% All 70% → 1827% Social advocacy 264% 233% Civic and social 107% 196% Grantmaking & giving 313% 176% Youth, social services 109% 167% Other education 117% 160% Arts, culture, recreation 119% 155% Other health 121% 114% Nursing homes 79% 63% Hospitals 58% 60% Higher education 38% 10% Not classified elsewhere 0% 21% Science and technology 134% 0% 50% 100% 150% 200% 250% 300% 350% % change in expenditures 1992-2005 (inflation adjusted)
For-profit The Johns Hopkins Center for Civil Society Studies CHANGES IN FLORIDA EMPLOYMENT BY REGION, NON PROFIT VS. FOR-PROFIT 2002-2005 7.0% State 8.5% Nonprofit 9.1% Tampa Bay Region 6.3% 8.9% South Central 8.6% 8.8% East Central 14.3% 7.7% North Central 8.1% 6.8% Southeast 9.3% 5.8% Northwest 9.4% 5.5% Northeast 7.2% -0.1% Southwest 15.7% 4% 8% 12% 16% -2% 0% 2% 6% 10% 14% Percent change in employment, 2002-2005
Nonprofit For-profit Public The Johns Hopkins Center for Civil Society Studies A COMPETITION CHALLENGE FOR FLORIDA NONPROFITS? 87.4% 80% 67.6% 60% 40% % of change in employment, 2002-2005 22.7% 22.1% 19.8% 20% 19.7% 18.9% 16.3% 10.1% 7.0% 6.9% 7.1% 8.6% 4.4% 6.6% 1.6% 2.5% 3.0% 0% 1.4% 4.5% 2.4% -12.3% -4.3% -11.9% Higher education State total Hospitals Other education Religious, grantmaking, civic associations Youth development, human services, food, shelter Home health care service Arts, entertainmt, recreation Nursing and Residential care -20%
The Johns Hopkins Center for Civil Society Studies NONPROFIT AS A PERCENT OF PRIVATE EMPLOYMENT BY FIELD IN FLORIDA,2002 vs. 2005 90% 84.2% 81.7% 80% 2002 70% 2005 65.6% 62.8% 60% 52.1% 51.4% 50% Percent of total private employment 38.5% 40% 31.6% 30.6% 30% 23.1% 23.2% 20.9% 20% 10% 5.8% 5.7% 4.8% 4.5% 0% Hospitals State total Nursing homes Home health Youth development, human services, food, shelter Higher education Arts, culture, humanities, and recreation Civic organizations
The Johns Hopkins Center for Civil Society Studies AVERAGE WEEKLY WAGES IN FLORIDA,NONPROFIT, FOR-PROFIT, AND GOVERNMENT $900 $822 $800 $733 $700 $668 $642 $600 $500 $400 $300 $200 $100 $0 Local gov State gov For-profit Nonprofit
Nonprofit For-profit The Johns Hopkins Center for Civil Society Studies COMPARATIVE AVERAGE WEEKLY WAGES OF NONPROFITS VS. FOR-PROFITS IN SELECTED SERVICE FIELDS, FLORIDA, 2005 $1400 $1259 $1237 $1200 $1000 $1000 $798 $800 $761 $737 $757 $678 $668 $642 $600 $551 $540 $533 $537 $502 $475 $458 $436 $428 $400 $342 $348 $269 $200 $0 Arts, culture, humanities, and recreation Youth development, human services, food, shelter State total Higher education Hospitals Grantmaking and giving services Home health Social advocacy organizations Science and technology Nursing homes Civic and social organizations
The Johns Hopkins Center for Civil Society Studies CONCLUSIONS AND IMPLICATIONS • A powerful engine for good -$48 billion “industry” -4th largest employer • Even greater potentials -Improve visibility/credibility -Boost giving and volunteering -Strengthen partnership w/government -Build capacity • The time is now.