Uniform Distribution
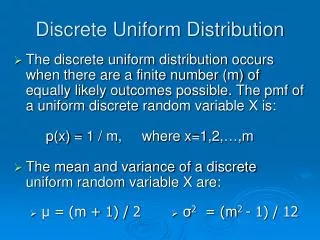
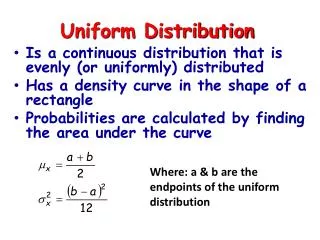
Uniform Distribution. Is a continuous distribution that is evenly (or uniformly) distributed Has a density curve in the shape of a rectangle Probabilities are calculated by finding the area under the curve. Where: a & b are the endpoints of the uniform distribution. 1/.12. 4.92. 4.98. 5.04.

Uniform Distribution
E N D
Presentation Transcript
Uniform Distribution • Is a continuous distribution that is evenly (or uniformly) distributed • Has a density curve in the shape of a rectangle • Probabilities are calculated by finding the area under the curve Where: a & b are the endpoints of the uniform distribution
1/.12 4.92 4.98 5.04 • The Citrus Sugar Company packs sugar in bags labeled 5 pounds. However, the packaging isn’t perfect and the actual weights are uniformly distributed with a mean of 4.98 pounds and a range of .12 pounds. • Construct the uniform distribution above. What shape does a uniform distribution have? What is the height of this rectangle? How long is thisrectangle?
1/.12 4.92 4.98 5.04 • What is the probability that a randomly selected bag will weigh more than 4.97 pounds? P(X > 4.97) = What is the length of the shaded region? .07(1/.12) = .5833
1/.12 4.92 4.98 5.04 • Find the probability that a randomly selected bag weighs between 4.93 and 5.03 pounds. What is the length of the shaded region? P(4.93<X<5.03) = .1(1/.12) = .8333
1/35 5 40 • The time it takes for students to drive to school is evenly distributed with a minimum of 5 minutes and a range of 35 minutes. • Draw the distribution What is the height of the rectangle? Where should the rectangle end?
1/35 5 40 b) What is the probability that it takes less than 20 minutes to drive to school? P(X < 20) = (15)(1/35) = .4286
c) What is the mean and standard deviation of this distribution? m = (5 + 40)/2 = 22.5 s2 = (40 - 5)2/12 = 102.083 s = 10.104 (Standard Dev.)