Download
1 / 42
420 likes | 510 Views
Event -by- Event Physics at SPS Energies. P. Christakoglou, A. Petridis † , M. Vassiliou Athens University HEP2007 - Workshop Athens - March 2007. Outline. Introduction Energy - Centrality dependence of e-by-e fluctuations particle ratio

E N D
Event -by- Event Physics at SPS Energies P. Christakoglou, A. Petridis†, M. Vassiliou Athens University HEP2007 - Workshop Athens - March 2007
Outline • Introduction • Energy - Centrality dependence of e-by-e fluctuations particle ratio average transverse momentum multiplicity net electric charge • System size, rapidity and energy dependence electric charge correlations • Conclusions
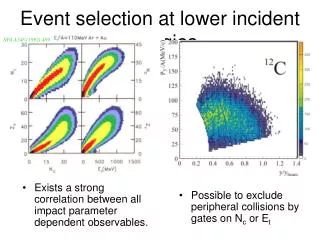
Introduction Event-by-Eventmeasurements offer the possibility for studying the QGP phase transition and the nature of the QGP matter. Pb+Pb collisions at top SPS energy: • Initial energy density exceeds the critical value predicted by lattice QCD • Strong collective behavior • Proposed signatures for deconfinement observed • Signatures not specific for deconfinement NA49 energy scan : 20, 30, 40, 80, 158 GeV/nucleon • To search for structure in the energy dependence of hadron production characteristics indicating the onset of deconfinement • To search for fluctuations which might occur if distinct phases coexisted in the early stage of the reactions or if hadrons froze out close to the critical point.
p > 7 GeV dE/dx forward rapidity 2,5 < p < 10 GeV : TOF + dE/dx at midrapidity The NA49 Detector Target: 20cm liquid H2 or Pb foil VCAL detects projectile spectators Δp/p2 = 7 (0.3) • 10-4 (GeV/c)-1 (VTPC-1, VTPC+MTPC) dE/dx resolution 3 – 6 % TOF resolution ~ 60 ps
Particle Ratio – Strangeness Fluctuations • Since the number of d.o.f in the QGP is lower than in a hadron gas ,non-Statistical fluctuations of the Κ/π ratio could signal fluctuations in the fraction of deconfined matter at the early stage of the collision. • NA49 performed measurements on particle ratios in single Pb+Pb collisions at all available beam energies.
Acceptance 40 GeV: 160 GeV: 20 GeV:
The Event-by-Event K/π ratio Beam Energy σ2dyn = σ2data – σ2mixed
The K/π ratio – Energy dependence Data : Increased fluctuation signal at lower beam energies UrQMD: Κ/π fluctuation signal independent of beam energy STAR
The Event-by-Event (p + p)/π ratio Beam Energy The distribution of the E-by-E p/π ratio is narrower for data than mixed events. Effect of baryon resonance decay ?
The (p + p)/π ratio – Energy dependence NA49 preliminary p/π fluctuation signal in UrQMD closely matches the energy dependence observed in the data
Event-by-event fluctuations of <pT> • The average transverse momentum in the event is related to the Temperature and the Radial flow in the fireball, which might fluctuate with the initial energy density and the fraction of deconfined matter at the early stage of the collision. • The fluctuation measure: To remove the influence of volume fluctuations, due to variations of the impact parameter of the collision
Event-by-event fluctuations of <pT> 1.1 < yπ < 2.6 • distributions of <pT> similar • for real and mixed events • non-statistical (dynamical) • fluctuations are small, < few%
Centrality and Energy dependence 158A GeV 1.1 < yπ < 2.6 1.1 < yπ < 2.6 NA49 preliminary increase for peripheral collisions, no increase at lower energy
Multiplicity Fluctuations • Used measure of fluctuations: scaled variance [ =1 for Poissonian distribution ] • Fluctuations of the charged particle multiplicity may be related to fluctuations in the initial entropy and the fraction of deconfined matter produced in the initial stage of the collision
Controlling Centrality AProj Veto Calorimeter • Veto calorimeter -> projectile spectators, number of projectile participants NPProj • Target spectators not measured in NA49 EVeto≈(AProj -NPProj)*Ekin NPProj
Multiplicity Fluctuations 1.1 < y < 2.6 For non central Pb+Pb coll. the distributions are wider than the Poissonian one (independent particle production)
Centrality dependence (I) • Var(n)/<n> increases with decreasing centrality • Large fluctuations for peripheral collisions may be caused by equilibration (mixing) of particle sources from the projectile and target nuclei
Results II Centrality dependence (II) HSD, UrQMD: V. Konchakovskyi et al. Phys. Rev. C 73 (2006) 034902 HIJING:M. Gyulassy, X. N. Wang Comput. Phys. Commun. 83 (1994) 307 Simulation performed by:M. Rybczynski • String hadronic models shown (UrQMD, HSD, HIJING) do not reproduce data on multiplicity fluctuations
Net Charge Fluctuations • Net charge fluctuations will be smaller in QGP (due to fractional charges of quarks) than in gas of hadrons • The Fluctuation Measure :
Net Charge Fluctuations ΔΦq = Φq - Φq,gcc QGP signature possibly erased by hadronisation (Bialas) or the effect of resonance decays (Zaranek)
Charge Correlations -The Balance Function Bass,Danielewicz,Pratt: PRL 85,2689(2000) • oppositely charged particles created • at the same point in space – time • particles get separated in rapidity by • thermal motion (rescattering) and • developing collective flow • early produced pairs are separated more • in rapidity than late produced pairs • separation δη quantified by the • balance function: delayed hadronisation = narrowing of balance function predicted as signature of phase transition
System size and centrality dependence - √sNN = 17.2 GeV The width takes its maximum value for p+p interactions. Data show a strong system size and centrality dependence. Neither HIJING nor shuffled data show any sign of system size or centrality dependence. C. Alt et al. [NA49 collaboration], Phys.Rev. C71, 034903 (2005).
Au+Au@ √sNN = 130 GeV J. Adams et al., (STAR Collaboration) Phys. Rev. Lett. 90, 172301 (2003) Comparison NA49 – STAR NA49 data show a strong centrality dependence of the orderof(17 ± 3)%. STAR data show also a strong centrality dependence of the order of(14 ± 2)%.
Mid – rapidity (2.5 < η < 3.9) Forward rapidity (4.0 < η < 5.4) Rapidity dependence - √sNN = 17.2 GeV
Conclusions At the SPS the NA49 exp. has studied the e-by-e fluctuations: • The K/π ratio fluctuation signal increases at lower SPS energies. • The fluctuations of <PT> show a system size dependence with a maximum for peripheral Pb+Pb collisions. • Similar dependence is found for the scaled variance of the multiplicity of neg. charged particles (possible correlation <PT> - multiplicity). • Measurements of fluctuations of the net electric charge do not show a reduction as had been proposed for QGP production . • The range of charge correlations (BF) decreases in central Pb+Pb collisions. The degree of reduction exhibits a smooth energy dependence
Conclusions (cont.) Further experimental studies: • Identify fluctuation signals of the onset of deconfinement • Search for the existence of the critical point of QCD. LoI NA49-future Collaboration: CERN-SPSC-2006-001,CERN-SPSC-235 “Study of hadron production in collisions of protons and nuclei at the CERN SPS”
Global view – Phase diagram Statistical model describes yields from AGS to RHIC energies T of “hadrochemical” freeze out increases decreases hadrochemical freeze out points at SPS energies approach the phase boundary
Vary relative normalization of the particle species (K/p,p/p) in the PDF Fit dE/dx spectra in 4D binning • Extract ratios with maximum likelihood fit Probability density function: <dE/dx> <dE/dx> log(ptot [GeV]) Event-by-Event estimationof the particle ratios One Event: Event Ensemble: <dE/dx> <dE/dx> log(ptot [GeV]) log(ptot [GeV])
Finite Number Statistics Experimental Resolution Dynamical Fluctuations “Data” Events s = 23.27% s = 15.9% s = 16.7% s = 2.8% Events Events Events Events = + + E-by-E K/p ratio E-by-E K/p ratio E-by-E K/p ratio E-by-E K/p ratio Statistical fluctuations = “mixed” Events s = 23.1% Events E-by-E K/p ratio Extracting the Fluctuation Signal Process the relative widths of the distributions:
Net Charge Fluctuations Energy dependence • The predicted large suppression of the net-charge fluctuations is not observed!
where P1: any rapidity interval in the detector P2: relative rapidity interval • Bass-Danielewicz-Pratt, Phys.Rev.Lett.85, 2000 • D. Drijard et al, Nucl. Phys. B(155), 1979 Charge Correlations -The Balance Function The Balance function is defined as a correlation in y of oppositely charged particles, minus the correlation of same charged particles, normalized to the total number of particles.
Mid – rapidity(1.8 < η < 3.2) Forward rapidity (3.3 < η < 4.7) Acceptance filter OFF Acceptance filter ON √sNN = 8.8 GeV – RAPIDITY DEPENDENCE
Mid – rapidity (2.5 < η < 3.9) Forward rapidity (4.0 < η < 5.4) Acceptance filter OFF Acceptance filter ON Rapidity dependence - √sNN = 17.2 GeV
Energy dependence of average transverse mass Increase of for final state particles (π,Κ,p) slows sharply at the lowest SPS energy
Energy dependence – pionyields • Increase of ratio with energy gets steeper in the SPS range • Pion deficit changes to enhancement compared to p+p • SMES: statistical model of the early stage Increase of initial d.o.f. between AGS and SPS
Energy dependence – ratio of strange hadrons to pions • Strangeness to pion ratio peaks • sharply at the SPS • The peak is not seen in p+p • collisions • SMES reproduces the data • Suggests ONSET of • deconfinement at SPS
Energy dependence of antibaryon/baryon ratios The effect of the increasing baryon density is seen in the strong decrease of antibaryon/baryon ratios towards lower SPS energies.