Download
1 / 6
60 likes | 224 Views
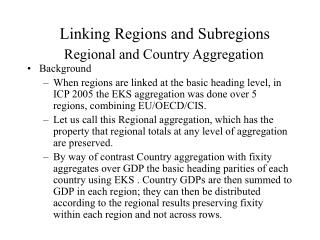
Linking Regions and Subregions Regional and Country Aggregation. Background When regions are linked at the basic heading level, in ICP 2005 the EKS aggregation was done over 5 regions, combining EU/OECD/CIS.

E N D
Linking Regions and SubregionsRegional and Country Aggregation • Background • When regions are linked at the basic heading level, in ICP 2005 the EKS aggregation was done over 5 regions, combining EU/OECD/CIS. • Let us call this Regional aggregation, which has the property that regional totals at any level of aggregation are preserved. • By way of contrast Country aggregation with fixity aggregates over GDP the basic heading parities of each country using EKS . Country GDPs are then summed to GDP in each region; they can then be distributed according to the regional results preserving fixity within each region and not across rows.
Linking Regions and SubregionsComparing Regional and Country EKSs • One motivation for Regional aggregation is negative, namely the non-comparability across rows at any level of EKS using Country aggregation with fixity. • But is the problem with Country aggregation or with fixity? • Consider a comparison in 2005 of Korea with China. In a Regional comparison, this is a 2nd class comparison, because the 2 countries are not classified in the same Region. • Does any of this make a difference? First, let us compare the regions including EKS and the CPD weighted or Rao method, and then look at some of country differences.
Linking Regions and SubregionsRegion and Country: Main Results • Column 1 is the Regional 2005 published Result; 2 is EKS over countries and 3 is the Rao labeled CPDw • The largest change is a rise of about 10% for CIS, probably because of use of Russia to link to OECD. However, the Rao shows a much smaller change. • Asia is up about 6%; South America is down about 5%; W. Asia is up and the EU/OECD and Africa are down about 2%. • For the Country aggregations weighted CPD/Rao in column 3 and EKS are quite similar. Not shown are unweighted G-K, which is similar to EKS and CPDw and. weighted G-K, which shows the most difference on average from the other methods.
Linking Regions and SubregionsSome Country Comparisons • To maintain regional fixity, we can simply apply the ratio of column (2) to (1) from the above Table to the Final Report country shares of world output within each region to obtain country shares. • This allows us to compare countries across regions using regions versus countries EKS aggregations, • For sake of completeness, the 3rd column in the next slide provides the individual EKS value aggregating across countries without fixity.
Linking Regions and SubregionsWorld Shares and GDP PC Selected Countries