Download
1 / 22
220 likes | 331 Views
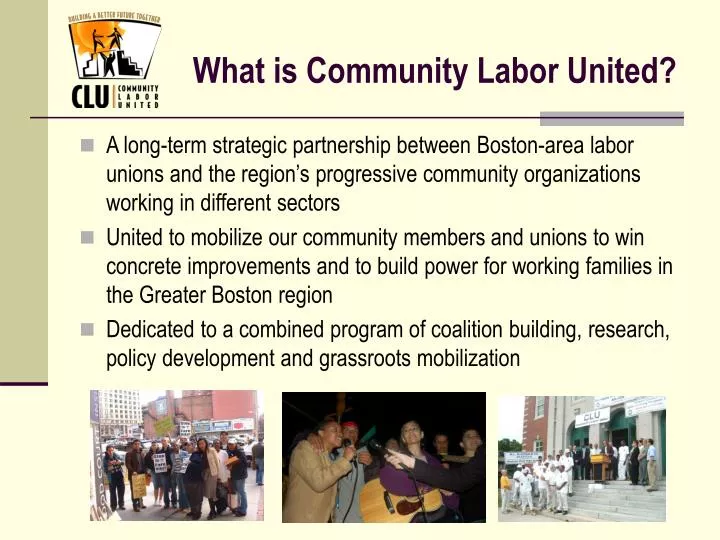
What is Community Labor United?. A long-term strategic partnership between Boston-area labor unions and the region’s progressive community organizations working in different sectors

E N D
What is Community Labor United? • A long-term strategic partnership between Boston-area labor unions and the region’s progressive community organizations working in different sectors • United to mobilize our community members and unions to win concrete improvements and to build power for working families in the Greater Boston region • Dedicated to a combined program of coalition building, research, policy development and grassroots mobilization
CLU Mission • To protect and promote the interests of low and moderate income persons in the Greater Boston region through joint organizing campaigns. • To build regional power through work that is rooted in the principles of equitable development, economic justice, the protection of the right to organize for workers, tenants and communities. • To actively contribute to the broad-based social movement for systemic economic and social change. • To dedicate its efforts to creating a new political power center in Greater Boston region that directly competes with the existing strength of the corporate community.
The Hourglass Challenge: Creating a More Equitable Economy for Greater Boston • The Changing Face of Greater Boston: A Demographic Profile • The Hourglass Economy and It’s Implications for Equitable Regional Growth • Vital Signs: A Snapshot of Housing, Health, Transportation, and Education • Next Steps Toward Building an Equitable Regional Economy in Greater Boston
The Changing Face of Greater Boston: A Demographic Profile • 4.4 million people live in the Greater Boston area • The city of Boston is now “majority minority” with over 50% people of color • Since 1980: the Latino population has more than doubled and the Asian population has increased five-fold • Brazilians account for 1 in every 5 immigrants • Seniors (55 and up) represent almost 20% of the population • 75% of Boston residents between the ages of 14 and 17 are Black, Asian or Latino
A Tale of Two Cities: GrowingIncome and Wealth Inequality • Today, a wealthy family has the income of seven poor families • A typical household today makes less money than in 1989 • People who are in the top 20% and already considered wealthy saw their income increase by more than 20% • People whose income is already below the poverty line saw their income decrease by 2%
The Hourglass Economy During the past three decades, the economy of Greater Boston has steadily shifted away from a manufacturing base towards service jobs. The result of this shift is the emergence of an 'hourglass' economy, with large numbers of low-wage jobs at one end of the spectrum and high-wage jobs at the other, but few opportunities in the middle. High-Wage Jobs Low-Wage Jobs
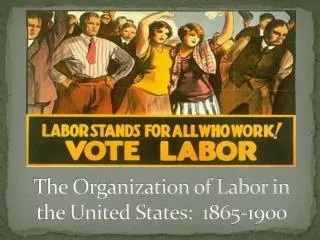
Boston Losing Good Jobs • Steady erosion of “good jobs” that pay high wages, offer union security and benefits • Service sector jobs traditionally non-union • Good jobs found in manufacturing and the public sector due to union organizing 12 Largest Employment Sectors--City of Boston 2003
It Pays to Be in a Union • Across all workers, occupations and sectors in the U.S., union members earn 28% more in wages than non-union employees • 52% of blue-collar workers in union shops earn $15.00 or more per hour, but only 17% of non-union workers make that much • 30% of service workers in union shops earn $15.00 or more per hour, but only 15% of non-union workers make that much • In terms of total compensation (health care and retirement benefits), union members earn just over 30% more than non-union employees
Fewer Manufacturing Jobs and More Low-Wage Service Sector Jobs • In the 1980s and 1990s, Suffolk County lost 47% percent of its manufacturing jobs and Middlesex County lost 75,000 manufacturing jobs • During that same period, Suffolk County added 85,000 service sector jobs and Middlesex County added 190,000service sector jobs • 71% of Boston’s projected new jobs through 2008 will be in service industries Service Sector 10% Manufacturing 8%
Occupation (one of MA’s 15 Largest) 2005 Wages Among Fastest Growing 2000-02 Predicted Top Growth to 2010 Food prep & fast food $9.47 X X Counter attendants $8.36 Waiters & waitresses $10.21 X Human service assists $13.26 X X Childcare workers $10.02 X Home health aides $11.16 X X Janitors and cleaners $11.84 Nursing aids&orderlies $12.51 X X Low-Wage Occupations: Largest and Growing Fast • 12 of the 15 largest occupations in Massachusetts pay wages below $15 per hour • Together these occupations make up more than 25% of Massachusetts total employment. • Most of these low-wage occupations have grown fast in the past decade • Many are projected to be among the state’s fastest growing occupations through 2010.
The Hidden Leading Sector: Non-Profit Institutions • Statewide, non-profits employ over 13% of the workforce • Healthcare and Social Assistance is Boston’s single largest employer • Education is the city’s 6th largest employment sector • The area’s largest hospitals generate revenue that rival many corporations
A Temporary Town: The Growth of Contingent Employment in Boston Q: What does “contingent” mean? A: Part-time, no job security, less pay and less or no benefits. For example: • Full-time contingent workers earned only 77% of what full-time workers make • Only 1/5 of contingent workers had health insurance from their employer, while 1/3 of non-contingent workers had some kind of health insurance • Between 1983 and 1999, the number of workers in Suffolk County employed by temporary staffing agencies increased by 165
Boston Underground: Misclassification and Beyond The Informal Economy Employers save big money and make even bigger profits • 58,000 Massachusetts construction workers are misclassified by their employers as independent contractors • 13-19% of all employers engage in misclassification Why? • Don’t pay payroll tax on earnings • Don’t pay standard wages • Don’t cover workers with unemployment insurance • Don’t pay workers’ compensation for injuries
The Rising Cost of Living • According to the Economic Policy Institute, Boston is now the most expensive metropolitan area in the country, more expensive than even New York City • EPI calculates that the annual income a 2 parent/2 kid family needs to meet basic needs in Boston is $64,656. New York is $58,656 and San Francisco is $57,624. • Housing prices have gone up faster than wages • 25% of all families in Massachusetts, and nearly 50% of urban families, do not earn enough to meet their basic needs.
Income • Median household income: $39,629 By race: • White: $47,668 • Blacks: $30,447 • Asians: $27,963 • Latinos: $27,141 On average, across race and education level, women earn 50% less than men
Poverty • During 2004-2005, almost three-quarters, or 74%, of all students in Boston public schools qualified for free or reduced lunch. • According to the U.S. Census, the poverty rate for Massachusetts in 2005 was 10.3%. • According to a MassINC report, 15.9% of immigrants were poor in 2000.
Unemployment The REPORTED unemployment rate is approximately 5%, but this figure does not consider those who are discouraged from looking for work. • Although Boston is now a 'majority minority' city, whites still make up the bulk of the metropolitan workforce. • As of 2004 the city's workforce was 85 percent non-Latino white. • Unemployment rates in 2000 for blacks and Latinos more than doubled that of whites, with Asian rates somewhat higher than that of whites
Housing Costs In the past 25 years, the average price of housing in the Commonwealth has increased more than in any other state Rental Costs Home Ownership • Boston rental housing costs rose 60% in only 5 years--from 1998 to 2003 • 3/4 of low-wage working families spend more than 1/3 of their income on housing • A minimum wage earner (earning $7.50 per hour) can afford monthly rent of no more than $360 • a full-time worker in Boston would need to earn an hourly wage of $27.58 in order to be able to pay the fair market value for a two-bedroom apartment according to HUD. • In 2005, the median priced single-family home in Boston cost $394,874--this means over 79% of families in Boston could not afford to purchase a home. • A projected 15,600 units are needed to meet housing demand annually • Affordable units constructed for those making 80 percent or less of median income is less than half of what is needed
Hunger and Health Care • According to the Massachusetts Division of Health Care Finance and Policy, 7.8% of Boston residents had no health insurance in 2004. • Low-income residents earning up to 300% of the federal poverty level will have to spend between $30 and $140 a month to buy health coverage under the state's new mandatory insurance law • Nearly 1 in 4 people receiving food support were actually working
Transportation • Today, transportation is the second largest household expense category after housing • The average household income in the Greater Boston area spends $7,175 on transportation per household • Households under the poverty level spend almost 40% of their household income on transportation • From 1990 to 2003, fares for subway and bus increased much faster than the cost-of-living, and even faster than the price of gasoline. • The average public transit commuter in Massachusetts spends 40 minutes on the bus or subway
Working Together with CLU • Equitable Distribution of Public Revenues • Negotiating Community Benefits Directly with Developers • Increasing Public Participation in the Decision-Making Process • Planning and Zoning Reform • Wage Standards • Lowering Barriers to Unionization