Download
1 / 37
370 likes | 407 Views
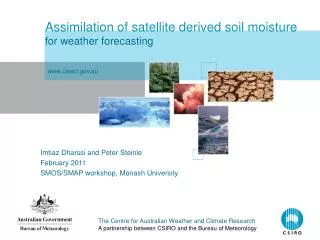
Explore the integration of satellite fAPAR for soil moisture assessment and CO2 assimilation by Wolfgang Knorr at Max-Planck Institute of Biogeochemistry, Jena, Germany. This study delves into the linkages between CO2 and climate, with mentions of ENSO trends and global drying. Utilizing tools like CCDAS, BETHY model simulations, and SeaWiFS fAPAR data, the research aims to optimize fAPAR assimilation for more effective carbon and water flux measurements.

E N D
Carbon, soil moisture and fAPAR assimilation Wolfgang Knorr Max-Planck Institute of Biogeochemistry Jena, Germany 1 Acknowledgments: Nadine Gobron 2, Marko Scholze 3, Peter Rayner 4, Thomas Kaminski 5, Ralf Giering 5, Heinrich Widmann1 2 3 LSCE QUEST / IES/JRC FastOpt 4 5
Overview • CO2 – climate linkages • Satellite fAPAR as soil moisture indicator • Assimilation of fAPAR
Atmospheric CO2 Measurements CCDAS inverse modelling period ... and more stations in CCDAS
Carbon Cycle Data Assimilation System (CCDAS) Assimilated Prescribed Assimilated CO2 + Uncert. satellite fAPAR + Uncert. Phenology Hydrology CCDAS Step 2 BETHY+TM2 only Photosynthesis, Energy&Carbon Balance CCDAS Step 1 full BETHY Background CO2 fluxes* Optimized Params + Uncert. Diagnostics + Uncert. * * ocean: Takahashi et al. (1999), LeQuere et al. (2000); emissions: Marland et al. (2001), Andres et al. (1996); land use: Houghton et al. (1990)
ENSO … preliminary results from extended CCDAS run Terr. biosphere–atmosphere CO2 fluxes
… global drying and warming trend ENSO and global climate normalized anomalies ENSO temperature –precipitation
for more information see: http://www.CCDAS.org
Overview • CO2 – climate linkages • Satellite fAPAR as soil moisture indicator • Assimilation of fAPAR
ITOC ITOC fAPAR: [(ITOC+IS)–(ITOC+IS)] / ITOC canopy IS IS soil Remotely Sensed Vegetation Activity
SeaWiFS fAPAR archive • developed by Nadine Gobron, Bernard Pinty, Frédéric Melin, IES/JRC, Ispra • 3-channel algorithm taylored to SeaWiFS ocean color instrument (blue, red, near-infrared) • cloud screening algorithm • requires no atmospheric correction • starts 10/1997, continuing... • being extended by same product for MERIS
Precipitation – fAPAR precipitation gridded station data soil moisture BETHY simulations leaf area index fAPAR satellite observations BETHY simulations
1-month lag r>0 r<0 4-month lag precipitation vs. fAPAR from SeaWiFS satellite obs. percent area with 99% significant correlation 0.5°x0.5°, ≥50% cloud free, ≥75% temporal coverage
1-month lag r>0 r<0 BETHY simulated fAPAR precipitation vs. fAPAR: satellite and model SeaWiFS fAPAR percent area with 99% significant correlation
r>0 r<0 precipitation vs. fAPAR: satellite and model 4-month lag SeaWiFS fAPAR percent area with 99% significant correlation BETHY simulated fAPAR
1-month lag r>0 r<0 BETHY simulated soil moisture precipitation vs. satellite fAPAR and simulated soil moisture SeaWiFS fAPAR percent area with 99% significant correlation
r>0 r<0 BETHY simulated soil moisture precipitation vs. satellite fAPAR and simulated soil moisture 4-month lag SeaWiFS fAPAR percent area with 99% significant correlation
ENSO – SeaWiFS fAPARlagged correlation 3-month lag
Overview • CO2 – climate linkages • Satellite fAPAR as soil moisture indicator • Assimilation of fAPAR
optimization mismatch satellite fAPAR fAPAR Assimilation PFT distribution* ecosystem model parameters Prescribed climate & soils data** BETHY model-derived fAPAR carbon and water fluxes
measurements model diagnostics error covariance matrix of measurements assumed model parameters a priori error covariance matrix of parameters a priori parameter values aim: minimize J(m) [for each grid point separately] The Cost Function Measure of the mismatch (cost function):
The Parameters vector of prior parameter values m0: represents: parameter vector m={m1,m2,m3}: m1 Tf shift of leaf onset/shedding temperature temperature limitation DTf=0 m2 wmax,0 (derived from FAO soil map) wmax maximum soil water holding capacity water limitation m3 fc fraction of grid cell covered with vegetation residual, unmodelled limitations (nitrogen, land use) fc,0 (function of P/PET and Temp. of warmest month)
T=5°C T=12°C for crops T=15°C ^ Prior Parameter 1 prior values: note: each 0.5°x0.5° has mixture of up to 6 PFTs map reflects presence of crops; red: unvegetated
bucket model: runoff =overflow precipitation =input full bucket: wmax current bucket: w wmax,0 [mm] Prior Parameter 2
^ fc,0=Pannual/PETannual*W(Twarmest month)/ Prior Parameter 3
Prior Parameter Errors error covariance matrix of parameters Cm0: • off-diagonal elements assumed 0 here = no prior correlation between errors of different parameters
The Assimilated Data model diagnostics vector y={y1,y2,...,y12}: yi modelled fAPAR of month i satellite-derived diagnostics vector y0={y0,1,y0,2,...,y0,12}: y0,i SeaWiFS derived fAPAR of month i
Prior Errors of Measurements error covariance matrix of measurements Cy: i=j • off-diagonal elements again 0 = no prior correlation between errors of different months
local site Parameter 2 (regional) soil water-holding capacity prior optimized
remote sensing data Local Simulations Paragominas 3°S 48°W 63 m precipitation [mm/month] fAPAR 1992 no remote sens. data fAPAR prescribed evapotranspiration [mm/month] NPP [gC/(m2 month)] fAPAR assimilated - -
remote sensing data no remote sens. data fAPAR prescribed fAPAR assimilated Measured Soil Moisture Paragominas 3°S 48°W 63 m precipitation [mm/month] fAPAR 1992 0...8m depth 0...2m depth - - 1992 1992
evapotranspiration (regional) prior optimized mm/year mm/year
Parag. July soil moisture (regional, dry season) prior optimized mm mm
Conclusions • The carbon cycle is highly sensitive to climate fluctuations • Vegetation can be quantified reliably from space • fAPAR lags precipitation by ~1–4(?) months • seems to behave similar to soil moisture • assimilation of fAPAR can deliver valuable information on soil moisture status
Conclusions • Need to improve phenology model • Implement sequential 2-D var assimilation scheme • Assimilate fAPAR into coupled ECHAM5-BETHY model (hope not too distant) goal: make fAPAR what SST is for ocean-atmosphere interactions... and improve seasonal forecasts