Download
1 / 56
610 likes | 1.43k Views
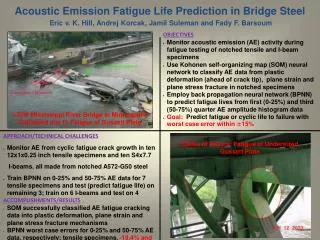
In-Flight Fatigue Crack Monitoring in Aircraft Using Acoustic Emission and Neural Networks. Eric. v. K. Hill Samuel G. Vaughn Christopher L. Rovik. Fatigue Crack Monitoring. Background Test Setup & Procedure Acoustic Emission Neural Networks Results Conclusions & Recommendations.

E N D
In-Flight Fatigue Crack Monitoring in AircraftUsing Acoustic Emission and Neural Networks Eric. v. K. Hill Samuel G. Vaughn Christopher L. Rovik
Fatigue Crack Monitoring • Background • Test Setup & Procedure • Acoustic Emission • Neural Networks • Results • Conclusions & Recommendations
Fatigue Cracking • Brittle failure in a normally ductile material due to cyclic loads below yield stress • Plastic deformation plus cyclic loads leads to strain hardening, then fatigue cracking • Small cyclic loads can cause significant damage over time
Notable Fatigue Failures • 1988 Aloha Airlines flight: a piece of a B-737 fuselage tore off during flight due to corrosion/fatigue cracking • Recent F-15E fuselage longeron failure behind cockpit – grounding of fleet • Aging aircraft are progressively accumulating fatigue damage • This leads to costly mandatory inspections and parts replacement at “safe” intervals
In-Flight Acoustic Emission Applications • Military: KC-135, C-5A, F-105 • Commercial: N/A • Civil: Piper PA-28 Cadet & Cessna T-303 Crusader Goal:In-flight fatigue crack detection systems promote maintenance schemes based on replacement for cause rather than replacement at conservatively calculated intervals using linear elastic fracture mechanics.
Relevant M.S. Theses • 1994 A.F. de Almeida: Neural Network Detection of Fatigue Crack Growth in Riveted Joints Using Acoustic Emission • 1995 W.P. Thornton: Classification of Acoustic Emission Signals from an Aluminum Pressure Vessel Using a Self-Organizing Map • 1996 M.L. Marsden: Detection of Fatigue Crack Growth in a Simulated Aircraft Fuselage • 1998 S.G. Vaughn III: In-Flight Fatigue Crack Monitoring of an Aircraft Engine Cowling • 1998 C.L. Rovik: Classification of In-Flight Fatigue Cracks in Aircraft Structures Using Acoustic Emission and Neural Networks
In-Flight Test Set-Up • 4 acoustic emission transducers symmetrically mounted on engine cowling • 2 transducers monitoring crack growth and the other 2 recording the noise • 3 Flights with 5 particular maneuvers monitored on each flight
Testbed 2: Vertical Tail Cessna Crusader N106ER
Acoustic Emission (AE) • Definition: • The transient elastic waves generated by the rapid release of energy within a material due to flaw growth mechanisms
AE Sources & Characteristics • Fatigue Cracking • Plastic Deformation • Mechanical Noise (Rubbing & Rivet Fretting)
Data Acquisition • AE source (e.g., fatigue crack) emits acoustic emission energy in the form of stress waves • Piezoelectric crystal within AE transducer senses the signal • AE signal amplified and transmitted to a computer where its waveform quantification parameters are digitized and stored • Records signals in the frequency range 100 kHz to 1 MHz
Classification Neural Network • Kohonen Self-Organizing Map (SOM) neural network uses mathematical processes to classify “things” based on a set of inputs: six AE quantification parameters (amplitude, duration, counts, energy, rise time, and counts-to-peak)
SOM Data Processing • Two primary steps in implementing a Kohonen SOM neural network: • Training the SOM – sample of data • Testing the SOM – remainder of data
Training the SOM • Create a training file • 5 steps to training: • 1. Randomly set weights between 0 and 1 • 2. Introduce first input vector ( 6 signal parameters for AE hit) • 3. Find minimal planar distance between the input vector and Kohonen neurons • 4. Identify the neuron with the minimal distance • 5. Adjust/update the weights
Testing the SOM • Create testing file • Pass test file through the trained neural network and it will be classified
Anticipated Results • Neural network classifies lab test data into 3 categories: fatigue cracking, plastic deformation, and rubbing (mechanical noise) • Trained neural network classifies the entire lab test file with a high degree of accuracy • In-flight data verifies fatigue crack growth between Channels 1 & 2 on Piper Cadet cowling • Fatigue crack growth activity associated with stressful maneuvers on Cessna Crusader vertical tail
Lab Test Results • Over twenty AE files were recorded during the lab fatigue tests • File twenty: 3 minutes 30 seconds in length; recorded fatigue cracking for the last minute • Duration vs. Amplitude plot of file twenty shows good separation between failure mechanisms
ATPOST Filtering Limits • AE sources filtered into individual files:
Training the SOM • 100 hits each of fatigue cracking, plastic deformation, and rubbing for a total of 300 hits were used for training • Trained neural network tested 99% accurate when testing the remaining 70,000+ hits • One column by three row (1x3) matrix Kohonen classification layer gave the most concise output
Output Observations • Fatigue crack growth unexpectedly detected on both sides of the aircraft cowling • Inspection revealed cracking between Channels 3 - 4 as well as 1 - 2 • Cracking in the engine cowling occurred predominantly during ground operations: taxi, take-off, and final approach/landing
Conclusions • SOM trained successfully to classify fatigue cracking, plastic deformation, and rubbing noises • Fatigue crack growth successfully detected in-flight from both engine cowling of the Piper PA-28 Cadet and vertical tail of the Cessna T-303 Crusader using AE parameter data • Engine cowling fatigue cracking occurred mostly during ground-based operations while vertical tail fatigue cracking occurred predominantly in-flight, especially during rolls and Dutch rolls • In-flight crack detection systems should help to minimize maintenance costs and extend the service lives of aging aircraft.