Topics, Summer 2008
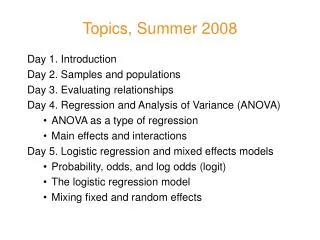
Topics, Summer 2008. Day 1. Introduction Day 2. Samples and populations Frequency distributions and probability density functions Measures of central tendency and dispersion

Topics, Summer 2008
E N D
Presentation Transcript
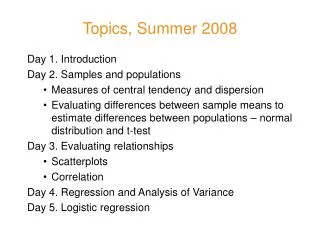
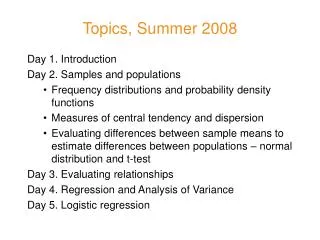
Topics, Summer 2008 Day 1. Introduction Day 2. Samples and populations • Frequency distributions and probability density functions • Measures of central tendency and dispersion • Evaluating differences between sample means to estimate differences between populations – normal distribution and t-test Day 3. Evaluating relationships Day 4. Regression and Analysis of Variance Day 5. Logistic regression
Distributions for nominal variables • Counts (i.e., frequency) How many Xs do I have? • Proportions (i.e., probability density) How many Xs do I have out of the total number of observations? Example: • How many of the clauses tagged in the Switchboard portion of the Bresnan et al. (2007) dataset show the PP realization of the recipient? • What proportion of the Switchboard observations …?
Frequency, probability, odds Frequency and expectation: • Of the 17 students who received financial support to attend the LSA Summer Meeting, how many do we expect to be women? • If 7 were women, is this deviation from expectation more than we would expect by chance? Evaluating frequency differences: • Of the tagged clauses in the Switchboard portion of the Bresnan et al. (2007) dataset, 79% show the PP realization of the recipient. • Is the proportion of PP realizations the same in the Wall Street Journal portion of the dataset?
Distributions for ratio variables • Raw counts of values not very useful How many Xs are equal to n1? How many Xs are more than n1 but less than n2? • Proportions What percentage of Xs such that n1 < x < n2? • Histogram: X={x1, x2, …, xn}, breaks = {b1, b2, …, bm } What percentage of Xs such that x ≤ b1 ? What percentage of Xs such that b1 < x ≤ b2 ? … What percentage of Xs such that bm-1 < x ≤ bm ?
Summary measures • Central tendency (expected value) • mode • median • mean • Dispersion (reliability of expectation) • range • inter-quartile range • variance • standard deviation
Distribution families • Uniform distribution Example: Expected value for throw of one die • Binomial distribution Example: Expected number of heads when n coins tossed • Normal distribution Example: Expected total value for throw of n=many dice Expected value for many variables that are the cumulative result of many independent influences