Download
1 / 33
330 likes | 509 Views
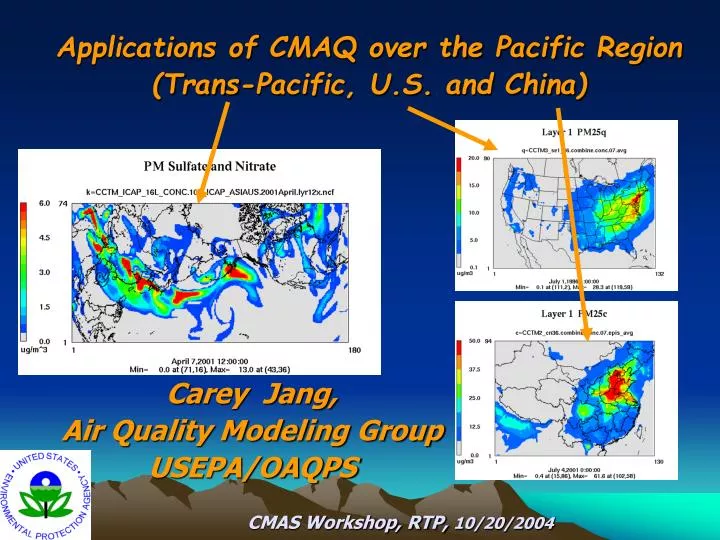
Applications of CMAQ over the Pacific Region (Trans-Pacific, U.S. and China). Carey Jang, Air Quality Modeling Group USEPA/OAQPS CMAS Workshop, RTP, 10/20/2004. OUTLINE. Applications of Models-3/CMAQ System over the Pacific Region

E N D
Applications of CMAQ over the Pacific Region (Trans-Pacific, U.S. and China) Carey Jang, Air Quality Modeling Group USEPA/OAQPS CMAS Workshop, RTP, 10/20/2004
OUTLINE • Applications of Models-3/CMAQ System over the Pacific Region • Trans-Pacific Transport Modeling of PM, O3, and Hg • U.S. and China Modeling Comparisons • Overview of China Regional and Urban Air Quality Modeling for Beijing Olympic 2008
Model-3/CMAQ Applications at EPA/OAQPS Trans-Pacific (ICAP) Modeling Domain 2001 ChinaModeling Domain U.S.Modeling Domain 36 km eastern US domain 4 km domain 12 km domain 12 km western US domain 36 km western US domain 36 km Annual National US domain
M3/CMAQ Applications at EPA/OAQPS • “Intercontinental” (ICAP) Modeling: EPA (Jang, Doll), UNC-CEP (Hanna, Vukovich, Xiu, Adelman), ANL (Streets), Harvard (Jacob), Stanford (Jacobson),U. of TN (Fu), U. of Iowa (Woo), NCSU (Wang, Xie), U. of Houston (Byun) • “U.S.” Modeling: EPAAir Quality Modeling Group(Jang, Dolwick, Phillips, Possiel, Timin, Braverman, Houyoux, Fox, etc.) in collaboration with EPA/ORD • “China” Modeling: EPA(Jang), U. of TN (Fu), ANL (Streets), U. of Iowa (Woo), NCSU (Wang, Xie), China (Tsinghua Univ. , SAES, CRAES)
Trans-Pacific, U.S., & China Modeling Modeling Tool: • U.S.EPA Models-3/CMAQ (“one-atmosphere”, multi-pollutants) system Emissions: • North America: • U.S.: NEI 1999 for point, area, mobile & BEIS-3 • Mexico & Canada : 1999 EI & BEIS-3 • Asia/China: • TRACE-P/ACE-Asia EI; GEIA for biogenic; • Local emissions for urban Beijing/Shanghai modeling Meteorology: • MM5 model (v3.5) for all three modeling domains
Intercontinental Transport and Climatic Effects of Air Pollutants (ICAP): EPA’s International Modeling Project Trans-Pacific Transport Modeling of PM, O3, and Hg
ICAP Trans-Pacific Modeling Domain Trans-Pacific Transport of Air Pollutants: PM
ICAP Trans-Atlantic Modeling Domain NOx Emissions VOC (PAR) Emissions
PM 2.5 (monthly average, 2001) January July 80 40 April October 40 40 ug/m3 ug/m3
PM 2.5 & Species (July average, 2001) PM 2.5 Sulfate PM 40 SO2 Emissions 20 4 Nitrate PM 10 Organic PM Other PM 2.5 Elemental Carbon 10 2 ug/m3 ug/m3
Ozone(Daily max, July 2001) July 12 July 1~31
Total Mercury Deposition January 2001, Monthly Sum July 2001, Monthly Sum
D PM 2.5 (Monthly Average, µg/m3)Impact from Asian Man-made Emissions January April 2 2 October ug/m3 July ug/m3 2 2 (Base case – Asian manmade emissions removed) ug/m3 ug/m3
DO3(Monthly Average, ppb) Impact from Asian Man-made Emissions 4 July O3 monthly avg. impact 4 April O3 monthly avg. impact ppb
NO Emissions SO2 Emissions 2001 (Base) IPCC 2030 A1B (Growth) IPCC 2030 B1 (Sustainable Development) January 15, 2001
100 PM 2.5 (Monthly Average) January 2001 (Base Case) 100 IPCC 2030 A1B (Growth Scenarios) 100 IPCC 2030 B1 (Sustainable Development)
70 Ozone (Monthly Average) July 2001 (Base Case) 70 IPCC 2030 A1B (IPCC Growth Scenarios) 70 IPCC 2030 B1 (Sustainable Development)
Model-3/CMAQ Applications at EPA/OAQPS Trans-Pacific (ICAP) Modeling Domain 2001 ChinaModeling Domain U.S.Modeling Domain 36 km eastern US domain 4 km domain 12 km domain 12 km western US domain 36 km western US domain 36 km Annual National US domain
U.S.-China AQ Management Assessment Project & China AQ Modeling Assessment Pilot Projects Beijing & Shanghai urban modeling efforts are underway Phase 2 4-km 12-km Phase 1 China national/regional modeling effort to be completed in Nov. 2003 36-km
China Modeling:PM 2.5 Speciation (July, 2001) Sulfate PM Nitrate PM 15 15 Organic PM Elemental Carbon 15 5
U.S. Modeling:PM 2.5 Speciation (July 2001) Sulfate PM Nitrate PM 10 4 1.5 Elemental Carbon Organic PM 10
Projected Air Quality over China in 2008 (July 4-20, 2001, episodic average) 2008 (Business as usual) PM 2.5 (No change from 2001) 2008 (Growth Scenario) 2008 (Control Scenario) (Man-made emissions + 50%) (Man-made emissions -- 50%)
Projected Air Quality over China in 2008 (July 4-20, 2001, episodic max) 2008 (Business as usual) Ozone (No change from 2001) 2008 (Growth Scenario) 2008 (Control Scenario) (Man-made emissions +50%) (Man-made emissions -- 50%)
Beijing/ Tianjin region 4-km grid Yangtze River Delta/ Shanghai region 4-km grid China Air Quality Modeling Projects China National/ Regional Domain 12-km grid 36-km grid Models-3/CMAQ Applications
AQ Issues in China/Beijing:PM 2.5 & Ozone Beijing Traditional Pollutants (Mr. X. Yu, US-China AQ meeting, DC, 2002) PM 2.5 Ozone 200 ppb 100 ppb 15 ug/m3 (Prof. Y.H. Zhang, ITAP workshop, Germany, 2002)
Smog in Beijing, China (Sept. 24, 2004) Smog Impact on Radiative Properties & Thermal Structure (AQ & Climate links)
Beijing Urban Modeling: (4-km) O3(avg.) O3(max) 100 160 Beijing ppb ppb (July 4-20, 2001, Episode max) Episode avg.)
VOC/NOx Ratio (July avg.) U.S. China (July 4-20, 2001, episode avg.) (July 1996, monthly avg.)
O3 Indicators (NOx- or VOC-limited) H2O2/HNO3 VOC/NOx (July 4-20, 2001, episode avg.)
Beijing Urban Modeling: (4-km) PM 2.5 (January 4-20, 2001, Episode avg.)
Clouds Regional pollutants transport may affect air quality in Beijing Beijing Tianjin pollutants pollutants Clouds (MODIS Satellite Image, December 24, 2003)
Air Pollution Control in 21st Century State/ Multi-Counties Federal/ Multi-State City /Town International County 1920 1950 1970 1980 1990 2000