Download
1 / 223
2.23k likes | 2.35k Views
The Zimbabwe Vulnerability Assessment Committee (ZimVAC) has released the 2013 Annual Rural Livelihoods Assessment (ARLA), providing an in-depth look at rural household livelihoods in Zimbabwe. This report evaluates essential aspects such as education, income sources, food security, and nutrition, aiming to inform government and partners on necessary interventions. By incorporating community perspectives and data from various national surveys, the ARLA serves as a critical tool for planning and addressing food and nutrition insecurity among vulnerable households. It expresses gratitude to partners supporting this vital initiative.

E N D
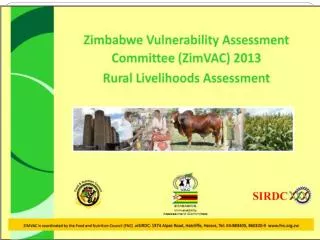
Foreword The Zimbabwe Vulnerability Assessment Committee (ZimVAC), as has become the tradition since 2002, conducted the Annual Rural Livelihoods Assessment (ARLA) number twelve. The assessment is part of a comprehensive information system that informs Government and its Development Partners on programming necessary for saving lives and strengthening rural livelihoods in Zimbabwe. ZimVAC is the central pillar around which the Food and Nutrition Council (FNC) plans to build its strategy to fulfil commitment number 6 of the recently launched Government of Zimbabwe Food and Nutrition Security Policy. The 2013 ARLA covers and provides updates on pertinent rural household livelihoods issues such as education, food and income sources, income levels, expenditure patterns, crop production, livestock production, child nutrition, water and sanitation, crop post-harvest management and issues associated with it. In addition to paying particular focus on and putting households at the centre of its analysis, the ARLA also collects and records rural communities’ views on their livelihoods challenges as well as their development aspirations. The ARLA recognises and draws from other national contemporary surveys that define the socio economic context of rural livelihoods. Most notable amongst these are Crop and Livestock Assessments, the Health and Demographic surveys, the National Census, the Poverty Assessment Surveys and national economic performance reviews. We commit this report to you all for your use and reference in your invaluable work. We hope it will light your way as you search for lasting measures in addressing priority issues keeping many of our rural households vulnerable to food and nutrition insecurity. We want to express our profound gratitude to all our Development Partners, in the country and beyond, for their support throughout the survey. Financial support was received from FAO, WFP and SADC-RVAA. Without this support this ARLA would not have been the success it is. We also want to thank our staff at FNC for providing leadership, coordination and management to the whole survey. It is our joint honour and pleasure to present this report. We hope it will improve short, medium and long term planning aimed at improving the quality of life amongst rural Zimbabweans.
Acknowledgements SIRDC and FNC, on behalf of the Government of Zimbabwe, wish to express their sincere gratitude and appreciation to the following ZimVAC members for their technical, financial and material support and contributions to the 2013 Rural Livelihoods Assessment: Food And Nutrition Council Scientific and Industrial Research and Development Centre Ministry of Local Government, Rural and Urban Development Ministry of Agriculture, Mechanisation and Irrigation Development Ministry of Labour and Social Services Zimbabwe National Statistics Agency Ministry of Health and Child Welfare Ministry of Education, Arts, Sports and Culture Food and Agriculture Organization World Food Programme United States Agency for International Development Famine Early Warning Systems Network United Nations Office for the Coordination Of Humanitarian Affairs Promoting Recovery In Zimbabwe (PRIZE) ACF Practical Action Christian Care World Vision Care International BHASO SAT Save the Children Zimbabwe IRC PLAN GOAL Caritas ORAP FACT COMMTECH CTDT CADS
Table of Contents • Background and Introduction………………………………………………………………………………….5 • Assessment purpose ……………………………………………………………………………………………..10 • Assessment Methodology………………………………………………………………………………………13 • Sample Demographics……………………………………………………………………………………………18 • Education ……………………………………………………………………………………………………………..24 • Water and Sanitation …………………………………………………………………………………………….31 • Household Income and Expenditure ………………………………………………………………………37 • Crop production……………………………………………………………………………………………………..45 • Small Grains…………………………………………………………………………………………………………..56 • Post Harvest…………………………………………………………………………………………………………..64 • Agriculture Commodities and Inputs Markets…………………………………………………….…73 • Irrigation Schemes………………………………………………………………………………………………….81 • Livestock ……………………………………………………………………………………………………………….86 • Household Consumption Patterns…………………………………………………………………………101 • Food Security Situation…………………………………………………………………………………….…..117 • Community Activities to Address Food and Nutrition Security Challenges…………....137 • Community Livelihoods Challenges and Development Priorities…………………………….139 • Conclusions and Recommendations ………………………………………………………………………142 • Annexes …………………………………………………………………………………………………………………152
Background- Economic Overview The Zimbabwean economy continued to post real growth in Gross Domestic Product (GDP) since 2009. GDP rose from about USD6.1 billion in 2009 to USD 6.7 billion in 2010 and USD 7.4 billion in 2011 (Zimstat, 2013). The economic growth rate slowed down to about 4.6% in 2012 mainly due to subdued performance of the agricultural sector. The maintenance of the multi-currency policy and pursuit of other economic stabilisation and growth policies have ensured general macro-economic stability. Year on year inflation has averaged out at around 4 % since March 2010 (MoEP&IP, 2012).
Background – Rural Poverty • The 2011/12 Poverty Income and Consumption Survey (PICES) estimated the head count of poor rural households in Zimbabwe at 76% in 2011. • The proportion of extremely poor rural households was 22.9%, this fell from 50.4% in 1995/6 and 42.3% in 2001(ZimStat, 2013).
Background - Agriculture Agriculture is a key livelihoods activity for the majority of Zimbabwe’s rural population. Mainly because of the poor rainfall season quality, production of major crops in 2012/13 fell compared to last season’s harvest. The Ministry of Agriculture Mechanization and Irrigation Development estimates the country will face a harvest cereal deficit of about 870,000MT in the 2013/14 consumption year (MoAM&ID, 2013). Livestock (cattle, sheep and goats) were in a fair to good condition in April 2013. Grazing and water for livestock were generally adequate in most parts of the country save for the communal areas, where it was, as is normal, generally inadequate.
Background - Nutrition It is against the foregoing socio-economic background that the 2013 ARLA was conducted. • ZDHS nutrition data from surveys conducted between 1999 and 2010/11 shows that the prevalence of stunting and underweight increased slightly between 1999 and 2005/06 and decreased between 2005/06 and 2010/11. • While the prevalence of underweight had a trend similar to that of stunting, wasting showed a consistent decline over the same period.
Background - Health • While some progress has been made towards reducing the rate of under-five mortality to 84/1000 in 2010-11. This is far off the desired target of 34/1000 by year 2015. • The infant mortality rate of 57/1000 in 2010-11 shows is also far off the 2015 target of 22/1000. • The maternal mortality rate has increased from 612/100,000 in 2005-06 to 960/100,000 in 2010-11. The adolescent birth rate has increased from 96/1,000 in 2009 to 114.6/1,000 in 2010-11. The rate is higher in rural areas (120/1,000 girls) than in urban areas (70/1,000). • HIV prevalence among population aged 15-24 years was 5.5%. The prevalence in women is much higher (7.8%) than in men (3.6%). • Malaria incidence appear to have dropped from about 5.8% in 2009 to 2.5% in 2011. Case fatality rates for the disease was at 4.5% in 2011.
Assessment Objectives Broad Objective • To assess the food and nutrition security for the rural population of Zimbabwe and update information on their key socio-economic profiles. Specific Objectives • To estimate the rural population that is likely to be food insecure in the 2013/14 consumption year, their geographic distribution and the severity of their food insecurity. • To describe the socio-economic profiles of rural households in terms of such characteristics as their demographics, access to basic services (education, health services and safe water and sanitation facilities), assets, income sources, incomes and expenditure patterns, food consumption patterns and consumption coping strategies. • To assess the availability and access to agricultural inputs and produce markets. • To assess crop post-harvest practices and identify opportunities for addressing potential post-harvest losses. • To assess access to education, and safe water and sanitation facilities by rural households and identify challenges to optimum access of the services. • To identify development priorities for rural communities in all rural provinces of the country. • To assess the nutrition status of children 6-59 months in sampled households.
Technical Scope The 2013 Rural Livelihoods Assessment collected and analysed information on the following areas: • Household demographics • Access to education • Water and sanitation • Food consumption patterns, food sources, household hunger scale, consumption coping strategies, and nutrition • Income and expenditure patterns and levels • Smallholder Agriculture (crop and livestock production, community gardens and irrigation) • Production and consumption of small grains • Post-harvest management by Smallholder Farmers • Household food security • Community livelihood challenges and development priorities
Assessment Methodology and Process • The assessment design was informed by the multi-sector objectives generated by a multi-stakeholder consultation process. • The technical team developed a community group interview summary form and a structured household questionnaire as the two primary data collection instruments. • A team of assessment supervisors was recruited from the Government, United Nations and Non-Governmental Organisations who are members of ZimVAC. This underwent a training-of trainers training in all aspects of the assessment. • Ministry of Local Government coordinated the recruitment of 8 provincial coordinators for the assessment and these in turn coordinated the recruitment of at least 4 district level enumerators in each of the 60 rural districts of Zimbabwe. Experience in data collection was used as one of the key enumerator selection criteria. • Provincial coordinators mobilised vehicles used by district enumerators from various Government departments as well as relevant NGOs for data collection in the respective districts. • A two day training in assessment data collection of district enumerators was conducted by the assessment supervisors during the period 29 April to 30 April 2013. • Primary data collection took place from 2 May to 13 May 2013 supported by national level supervisors and provincial coordinators. • The assessment made a concerted effort to raise awareness of not only the assessment but also broader ZimVAC activities amongst District Administrators and Rural District Council Chief Executive Officers. • Centralized data entry took place from 6 May to 17 May 2013 in Harare. This was followed by an intensive process of checking the accuracy of data entry. • Data analysis and report writing was done from 21 May to 6 June 2013 by the assessment technical team. Various secondary data was used to contextualise their analysis and reporting. The analysis and reporting was subjected to peer review and correction.
Primary Data Collection Sample The sample was designed such that key assessment results were representative at district and provincial levels. The sampled wards were derived by probability proportional to size (PPS), using the ZIMSTAT 2012 sampling frame. At least one enumeration area was then randomly selected in each of the selected wards for enumeration. A minimum of 15 wards were visited in each district. In each EA, 12 households were systematically randomly selected and interviewed. The final sample size for the survey was 10 797 households and 887 community key interviews.
ZimVAC Rural Assessment May 2013 Sampled Wards
Data Entry, Cleaning and Analysis • Primary data collected was entered using the Census and Survey Processing System (CSPro) and exported into the Statistical Package for Social Sciences (SPSS). • Most of the data cleaning and analysis was done using SPSS complemented by MS Excel and Geographic Information System (GIS) packages.
Sex and Age of the Household Head • The sampled households had an average size of 5.4 and the mode of 5 persons in a household. • Of the sampled households, 65.8% were male headed and 34.2% were female headed. • The average age of the household head was 49.3 years.
Marital Status of Household Head • The majority (65%) of the household heads were married and living with their spouses followed 21% who were widowed. • About 30% of the households were elderly headed (60+ years) while 0.2% were child headed. • This picture is consistent with findings from previous ZimVAC assessments.
Sample Distribution by Age and Household Size The majority of members of the households were aged 18-59 years. This suggests that the rural population is relatively young and this is similar to results from other comparable surveys.
Vulnerability Indicators • Households with at least an orphan were 27% of the sample. This shows a decreasing trend given that it was 35% in 2010, 32% in 2011 and 30% in 2012. • Of the sampled households, 7% were hosting a chronically ill member compared to 8% in 2012 and 8.4% in 2011. • 7% were hosting a physically or mentally challenged member, a figure lower than 8% in 2012. • About 35% of the sampled households reported to be hosting at least a member who was either chronically ill, physically/mentally challenged or an orphan. • There is generally a decreasing trend on vulnerability attributes such as the presence of a chronically ill, physically or mentally challenged member or an orphan.
Dependency Ratio • In this survey, household dependency ratio was computed as follows: Number of economically inactive members/ Number of economically active members. • The average household dependency ratio for the sampled households was 1.8 which is higher than that of 2012 (1.6). • The highest dependency ratio was recorded for Matabeleland South (2.1) followed by Masvingo (2.0).
Education To describe the socio-economic profiles of rural households in terms of such characteristics as their access to education
Out Of School Children by Province The results showed that 12% of children of school going age (5-17 years) were not in school at the time of the assessment. Matebeleland North (14%), Mashonaland Central and Matabeleland South (13%) hadthehighest proportions of children of the school going age who were not going to school. Mashonaland West (9%) had the lowest proportion of children of school going age who were not in school at the time of the assessment. These findings are similar to those from previous ZimVAC assessments.
Reasons for Not Attending School The major reason why children were not in school was financial constraints (55%). About 11% of the children were not in school because they were considered too young, which implies that these children will start school at an older age. The percentage of households with children considered too young to go to school decreased significantly from 34% in 2012 to 11% in 2013. This might have been caused by the introduction of satellite schools and Zero Grades. The reasons such as not interested in school/lazy and completed 0/A level (6%) were reported significantly.
Districts With the Highest and Lowest Proportions of Children Out of School The proportion of children of school going age who were not in school at the time of the assessment was highest in Mudzi (27%), followed by Umguza (23%) and Tsholotsho (20%). Mudzi had a significant increase of children who were out of school at the time of the assessment compared to the previous assessment. Chikomba (3%), Makonde (3%) and Hwedza (2%) had the lowest proportions of children of school going age who were out of school at the time of the assessment.
School Attendance by Gender by Province • Nationally, 12% boys and 11% girls of school going age were not attending school at the time of the assessment. • Matabeleland North (16%) had the highest proportion of boys who were not in school at the time of the assessment, while Mashonaland Central (14%) recorded the highest proportion of girls who were not in school. • The lowest proportion of boys who were not in school was recorded in Midlands (9%) with Mashonaland West (8%) recording the lowest proportion of girls who were not in school.
Water and Sanitation To record households’ access to improved drinking-water sources and improved sanitation facilities
Nationally, 70% of the rural households in Zimbabwe used drinking water from improved sources. Coverage of improved drinking water sources was highest in Mashonaland Central, and Matabeleland North (77%). Mashonaland West and Masvingo (38%) had the highest proportion of households accessing water from unimproved sources. These results compare closely with those from the Zimvac 2011 rural livelihoods assessment. Household Sources of Water
The practice of water treatment continues to be generally low across all rural provinces. About 18% of households using unimproved water sources treated their drinking water. In 2011, 17% of the rural households reported treating water from unimproved water sources. Matabeleland North (12%) and Matabeleland South provinces (14%) had the least proportion of households treating their water from unimproved sources. Like the results from the Zimvac 2011 ARLA, Mashonaland Central(27%) and Mashonaland West(21%) had the highest proportion of households treating water from unimproved water sources. Proportion of Households Treating their Water
Proportion of Households Treating Water from Main Source by Method and Province • Of those that treated water from their main drinking source, 44% used a water treatment tablet, 30% were boiling their water and 20% were adding bleach or chlorine to their water. • Water boiling is most common in the two Matabeleland provinces. Adding bleach is most popular in Mashonaland East province and Use of a treatment tablet is most common in Manicaland, Mashonaland Central and Mashonaland West provinces.
% Households Sanitation Facility • Nationally, 48% of the sampled households were using improved sanitation facilities and 39% were practicing open defecation. • Matabeleland North (70%) and Masvingo (54%) had the highest proportion of households practicing open defecation. • The best provinces regarding access to improved sanitation facilities that are not shared were Matabeleland South (43%) and Mashonaland East (41%).
Household Income and Expenditure Patterns To describe the socio-economic profiles of rural households in terms of such characteristics as their income sources, income and expenditure patterns
Most Common Household Cash Income Sources used by Rural Households • The most common household cash income source reported was casual labour (23% of the sampled households). • Food crop production/sales and remittances were second and third at about 12% . • The least common cash income source was small scale mining at 2%. • All Mashonaland and Midlands Provinces ranked food crop sales as the second most common income source. • Remittances was ranked second in the two Matabeleland Provinces and in Masvingo Province • This trend is the same as that obtained last year
Average Household Income by Province April 2013 • The national average household income for April 2013 was US$95, an increase of about 12% from the same time last year. • The highest average household income was reported in Mashonaland West at US$143, followed by Mashonaland Central at US$140. This was mainly due to revenue from cash crops(mostly tobacco). • The least amount of average income was reported in Matabeleland North at US$60. • Matabeleland North recorded a marked decrease in average household income compared to last year.
April 2013 Average Household Income Distribution • 90% of the rural households earned less than US$250 in April 2013. The bottom 50% of these earned less than US$50 and the bottom 20% earned less than US$20. • This distribution pattern was very similar across all provinces. Marked differences were noticeable in the average household income of the top 10% and this explains the differences in the provincial level average household incomes.
Educational Level of Household Head versus Income • Households with household heads with tertiary education reported the highest level of income while those without any level of education reported the least average income . • Similar results were obtained by the 2010/2012 (Poverty, Income, Consumption and Expenditure Survey (PICES).
Ratio of Household Expenditure: Food & Non-Food Items for the Month of April 2013 • Food items constituted the greatest share of most rural households’ expenditure at 56% compared to the share of non-food items at 44%. • This is a typical expenditure pattern for poor households. Remember 76% of rural households were classified as poor by the PICES 2011.
Provincial Outlook: Expenditure on Food and Non Food Items • Matabeleland South had the highest expenditure on food items (64%) followed by Matabeleland North and Manicaland both at 61%. • Mashonaland West had the highest expenditure on non-food items at 55%. • Generally, most households spent most of their income on food items (57%). • Provinces which reported high levels of own crop production had the least expenditure on food items. The converse is also true.
Average Household Monthly Expenditure for April 2013 by Province • Matabeleland South had the highest expenditure in April 2013 (US$56) while Matabeleland North had the lowest (US$39).
Crop Production To describe the socio-economic profiles of rural households in terms of such characteristics as their income sources and income levels
Proportion of Households Growing Crops • The most common crop grown by the majority of households was maize (80%). This is comparable to the 2011/12 season (79%). • Groundnuts came next with 32% of households planting the crop, 6% lower than last season. • Fewer households planted small grains in the 2012/13 season compared to the previous season. • An increase was recorded in households growing Tobacco, but there was a drop in those growing cotton. • Besides rainfall and crop input related reasons, planted maize area decline in the Mashonaland Provinces (>30% of households growing the crop) could be attributed to a shift towards cash crops (mainly tobacco). Maize is increasingly becoming unviable as a cash crop. • Yet in Masvingo, southern Midlands, southern Manicaland, Matabeleland North and Matabeleland South, the reasons for decline are more to do with poor rainfall and access to crop inputs.
Sources of Maize Seed • The main source of maize of seed planted by the sampled households was purchases (39%), followed by Government support (26%). • About 4% of the households got the maize seed they planted from NGOs • 12% of the households obtained their maize seed from retained seed. This is largely explained by financial constraints
Sources of Maize Seed by Province • Government maize seed support was most prominent in Matabeleland South (37%) and Mashonaland Central (33%). • The highest proportion of households which used carryover maize seed were in Matabeleland North (18%) and Mashonaland East (12%). • Between 12% and 16% of the households in Midlands, Mashonaland West, Manicaland and Matabeleland North used retained seed. • Remittances were highest in Manicaland(14%) and Masvingo(11%) provinces
Sources of Seed for Major Crops • The main source of seed for small grains and pulses was retained seed This was followed by carry over for the cereal crops.
Sources of Small Grain Seed by Province • The majority of households (48%) used retained small grain seed. 26% used carry over seed and 23% used seed obtained through remittances. Purchases were the main source of seed for 15% of the households. Households that obtained small grain seed from government and NGOs were 8% and 6% respectively. • Manicaland had the highest proportion (61%) of households which used retained seed. Carryover seed was most prominent in Mashonaland East (50%), followed by Matabeleland North (44%) and Mashonaland Central (42%). • Government support was most prevalent in Matabeleland South where 14% of the households were supported. NGO support was significant in Masvingo where 12% of the households had benefited.
Proportion of Households Which Planted Maize • Midlands, Manicaland and Mashonaland Provinces had the highest proportions (>80%) of households growing maize. • Matabeleland South had the least proportion of households growing maize (60%), a drop from last season (72%). • There was a relative increase in households producing maize in Masvingo Province despite an adverse rainfall season.
Change In Area under Maize • The majority of households (45%) which planted maize in the 2012/13 season maintained area planted under maize the same as they had for the 2011/12 season. About 35% increased the area planted to maize and 20% of the households reduced. • Of the 20% that reduced area planted to maize, the major reasons were high costs, late availability and unavailability of crop inputs (40%), late start and erratic rainfall (38%) and lack of draught power (7%).