Download
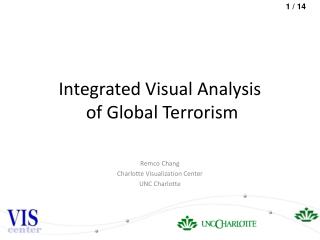
1 / 15
150 likes | 176 Views
Explore the complex dataset of global terrorism incidents from 1970 to 1997 through an integrated visual analysis at UNC Charlotte Visualization Center. Utilize various visualization techniques to uncover trends, relationships, and patterns within the data, including Entity Relationships, Dimensional Relationships, Entity Analysis, and Parallel Sets View. Dive deep into the GTD dataset with dynamic filtering and Grouping using MDS in 2D. Enhance your understanding through Multimedia Analysis and discover breaking news and hot topics over time. Collaborate with leading institutions in the field for a comprehensive analysis of terrorism data and news content.

E N D
Integrated Visual Analysis of Global Terrorism Remco Chang Charlotte Visualization Center UNC Charlotte
GTD Data • It’s a large dataset. GTD has 59,603 incidents, with 119 attributes (dimensions) for each incident. • It covers almost all incidents happened from 1970 to 1997, across the whole world. • It contains mixed types of attribute --- Categorical and Numerical. • It also includes uncertain/unknown incidents.
Visual GTD Flow Chart Entity Relationships (Geo-temporal Vis) Dimensional Relationships (ParallelSets) Entity Analysis (Search By Example)
WHO – Terrorist Groups Five Flexible Entry Components What WHERE~ WHEN
Enter System by single or multiple Selections System will supply Specific Information Drilldown to Original Info
Parallel Sets View • Parallel Sets • Displays relationships among categorical dimensions • Shows intersections and distributions of categories
Parallel Sets View • Dynamic filtering on continuous dimensions can show more information • Here we see the large proportion of facility attacks and bombings in Latin America during the early 1980s
Analysis using Longest Common Sequence (LCS) • Two strings of data (each representing a series of events) • GATCCAGT • GTACACTGAG • Basic algorithm returns length of longest common subsequence: 6 • Can return trace of subsequence if desired: • GTCCAG • GATCCAGT • GTACACTGAG • Additional variations can take into account event gap penalties, time gap penalties, and exploration of shorter, or alternate, common subsequences
Grouping using MDS in 2D • Each o represents a terrorist group • Groups form cluster according to naturally occurring trend sizes • Sharp divide between large clusters in right hemisphere • Left hemisphere contains many smaller clusters MDS Analysis by TargetType
Integrated Terrorism Analysis Multimedia Real Time Known Events Visual GTD
Video Analysis Goals • to describetrends in news content over time • to discoverbreaking news and hot topics over time • to trace conceptual development of news • to retrievenews of interests effectively • to collect evidences and test hypotheses for intelligent analysis • to comparegroup (such as different channels) differences in content • to associatenews content with social events
Video Analysis Example CNN Fox News MSNBC • News contains view points and opinions • Find local, regional, national, and international reports of the same event to get a complete picture
NVAC Collaborations • PNNL – A. Sanfilippo (Content Analysis and Information Extraction of closed caption) • PNNL – W. Pike (Emotional state extraction from closed caption) • Penn State – A. MacEachren (Geographical analysis) • Georgia Tech – J. Stasko (Jigsaw, entity relationships) • Visual Analytics is the point of integration!!
Integrating Terrorism Data Analysisand News Analysis Terrorism Visual Analysis Terrorism Databases Terrorism VA Jigsaw NVAC Stab/ TIBOR Reasoning Environment Framing, Affective Analysis Broadcast VA News Visual Analysis News Story Databases Next: full, Web-based multimedia content