This is Lewisham
290 likes | 309 Views
Explore the political landscape of Lewisham Borough, including its governance structure, council makeup, and key committees. Learn about the diverse demographics, thriving small businesses, and cultural richness within the community.

This is Lewisham
E N D
Presentation Transcript
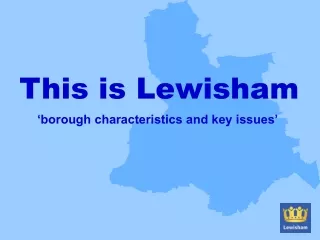
This is Lewisham ‘borough characteristics and key issues’
“the will of the people is supreme” The London borough of Lewisham was created in 1965
All of Lewisham’s 54 councillors are from the Labour Party. The only time that Labour has not been the largest party in the Council was in 1968, when the Conservative Party controlled the Council. political make-up
council • consists of 54 elected councillors, three for each of the 18 wards • appoints the overview & scrutiny committee and other committees • approves the policy framework and budget statutory committees standards committee health & well being board mayor and cabinet the mayor • is elected by the whole borough to lead and speak up for the whole borough; • chooses up to nine councillors to form the cabinet with specific areas of responsibility; • sets out major decisions to be taken in a Forward Plan published monthly; • proposes budget and key policy proposals to council; • takes decisions to implement policy within agreed policy framework; • considers recommendations for actions with officer advice the cabinet • provide advice to the mayor; • jointly with the mayor take decisions overview and scrutiny • meets at least once a year and is ultimately responsible for overview and scrutiny; • delegates work to other scrutiny bodies - six select committees, two business panels, all of which are formally sub committees of overview and scrutiny; • the business panel co-ordinates the work programmes of select committees; • the six select committees draw up work programmes each year to hold the Mayor and senior officers to account for decisions; check performance; examine issues in depth and make recommendations for policy development; • responsibility for scrutinising health services and health issues with the healthier communities select committee, which makes suggestions to the local health trusts for action and improvements; • the safer stronger communities select committee has responsibility for fulfilling the overview and scrutiny functions in relation to crime reduction and equality of opportunity; business panel regulatory committees licensing (x2). These committees are responsible for all entertainment licensing and the provision of late night refreshment. planning (x4). The planning committees consider planning matters across the whole borough. The Strategic Committee only considers strategic regeneration proposals. other committees audit panel appointments elections health & safety pensions investment working parties constitution working party children & young people select committee healthier communities select committee public accounts select committee safer stronger communities select committee sustainable development select committee housing select committee
167languages are spoken by pupils attending Lewisham schools. Lewisham is home to some 0 301,300 7 residents Lewisham is home to residents from more than70nationalities and five continents. Onein four Nearly three in tenLewisham residents are older adults aged 65 plus Lewisham residents is a child or young person aged 0-19. 83.1 Lewisham’s population is driven by natural change [the difference between births and deaths]. There are 133,000 households in the borough. Lewisham has one of the highest concentrations of small businesses in the country. Average life expectancy in Lewisham is 79.1 yearsfor males and 83.1 yearsfor females.
Lewisham is the 13th largest borough in London by population size and the 5th largest in Inner London Southwark Source: MYE 2017, Office for National Statistics
Lewisham Central is the most populous ward with over 20,000 residents. The chart also shows that four of the five most populous wards (Brockley, Evelyn, New Cross and Telegraph Hill) are in the north of the borough, whilst three of the five least populous wards Downham, Whitefoot and Grove Park) are in the south of the borough. Source: Ward Profiles and Atlas, GLA 2015
34.2% 46.4% 46% [2011 Census ONS] of residents are of black and ethnic minority heritage 49% (2011 Census ONS]) of residents are men 35.9% 32.7% 53.6% of residents aged 16+ are married (2011 Census, ONS) 51% (2011 Census ONS]) 25.7% of residents are women 301,300 residents (MYE 2016, ONS) 25.2% of residents are aged 0-19 (2011 Census, ONS) 65.8% 54% (2011 Census, ONS) of residents are White 15.6% of residents are living with long-term conditions (a proxy measure for disability) (2011 Census, ONS) 14.5% 69.6% 64% (2011 Census, ONS) 11% 9.5% of residents are aged 65+ (2011 Census, ONS) of residents identify as having a faith Note: percentages outside the bubbles are from the 2001 Census borough demographics
A truly global borough….. Fiji Canada Belgium Austria Denmark Australia Estonia Finland Great Britain India Italy Holland France Guyana Ghana Germany 75 Nigeria New Zealand Malaysia Jamaica Lithuania Mauritius Latvia Malta Romania Republic of Ireland Portugal Slovakia Pakistan Poland Sierra Leone Singapore Sri Lanka Spain South Africa Trinidad Slovenia Uganda Sweden Zimbabwe The 207,343 people on Lewisham’s electoral roll comprise more than 75 nationalities and five continents Source: Lewisham Electoral Services
The chart below shows nationalities on Lewisham’s Electoral Roll that are at or above triple digits. Aside from those who identify as British, which comprise almost 200,000 of those of Lewisham’s Electoral Roll, the top ten most numerous non- British nationalities in the borough are Irish, Nigerian, Italian, Polish, Jamaican, French, Spanish, Romanian, Portuguese and German. Of the 35,646non-British residents (from 71 nations) on Lewisham’s Electoral Roll, two-thirds are from one of the above-mentioned nationalities. 8 of the top ten countries are in the EU. Nigerian and Jamaican are the only non-EU nationalities in the top ten. Source: Lewisham Electoral Roll 2018
The chart below shows growth or contraction in population size between 2015 and 2018. The In particular, the chart shows that, at 819, Italian is the fastest growing nationality in Lewisham followed by Romanian 785, Spanish 625, and Portuguese 383. Source: Lewisham Electoral Roll 2015, 2017, 2018
Lewisham’s Electoral Roll is comprised of 23,500 citizens of EU member states. Nearly 50% of EU citizens living in Lewisham are from just four nationalities: Irish, Italian, Polish and French. Source: Lewisham Electoral Roll 2017
The map breaks down urban deprivation into lower geographies. It shows that whilst Lewisham was less deprived in 2015 compared to 2010, concentrations of deprivation in the north and south of the borough remain comparatively high. Source: Indices for Multiple Deprivation, 2015
*1= most deprived; 326 = least deprived Source: Indices for Multiple Deprivation, 2015
Median income in Lewisham is £28,265. Down from £ 31,718 in 2013. Richmond upon Thames had a median income of £46,198. The highest of any borough. Median Income (£) 2016 Barking & Dagenham had a median income of £20,796. The lowest of all London boroughs. Only 7 other boroughs in London had lower median income than Lewisham.
More income deprived children live in Evelyn than Crofton Park, Blackheath and Lee Green put together. Source: Indices for Multiple Deprivation, 2015
The chart below shows changes in the tenure of households in the borough between the two censuses in 2001 and 2011. It reveals that all forms of home ownership accounted for 50.1% of tenures in 2001 compared to 43.6% in 2011, whilst all forms of renting accounted for 49.9% of tenures in 2001 compared to 55.4% in 2011. All forms of home ownership All forms of renting Rent free Source: 2011 Census, Office for National Statistics
The chart shows changes in the average house price in Lewisham compared to London over the period June 2017 to April 2018. It shows between the above mentioned period, the average house price in Lewisham has increased by 3.7%. This compares to an average house price increase for London of 1% over the same period. Source: Land Registry, September 2017
This chart shows average life expectancy for men in Lewisham compared to England. It shows that the difference in average life expectancy between Lewisham and England narrowed to 0.5 years in 2016. However, since 2016, the gap has increased to just over one year. Source: Public Health England 2006-18
This chart shows average life expectancy for women in Lewisham compared to England. The chart shows that average life expectancy for females in Lewisham has been at or above the England average since 2016. Source: Public Health England 2006-18
PTAL is a measure of connectivity by public transport, which has been used in various planning processes in London for many years. For any selected place, PTAL suggests how well the place is connected to public transport services. It does not cover trips by car. PTAL values are simple. They range from zero to six, where the highest value represents the best connectivity. A location will have a higher PTAL if: • It is at a short walking distance to the nearest stations or stops • Waiting times at the nearest stations or stops are short • More services pass at the nearest stations or stops • There are major rail stations nearby • Any combination of all the above. 1a 1b 2 3 4 5 6a 6b Public Transport Access Levels(PTAL)