Download
1 / 23
230 likes | 384 Views
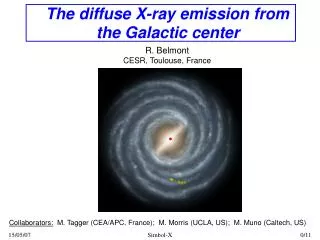
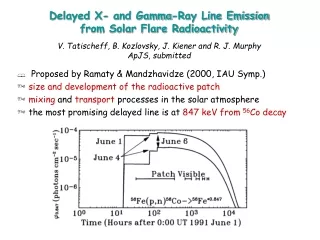
The Influence of the Return Current and Electron Beam on the EUV and X-Ray Flare Emission. E. Dzifčáková, M. Karlický Astronomical Institute of the Academy of Sciences of the Czech Republic 251 65 Ondrejov, Czech Republic. Motivation.

E N D
The Influence of the Return Current andElectron Beam on the EUV and X-Ray Flare Emission E. Dzifčáková, M. Karlický Astronomical Institute of the Academy of Sciences of the Czech Republic 251 65 Ondrejov, Czech Republic
Motivation • The electron beams accelerated during a flare in the corona create return currents in lower layers of the solar atmosphere. • The electron beam and the return current affect the electron distribution function in the solar transition region and the corona and thus the intensities of the spectral lines. • Does the return current influence the intensities of the spectral lines in EUV and X-ray region? • Is it possible to separate the effect of the return current on a spectrum from the effect of the electron beams and to diagnose it? At first we considered a very simple model to know what kind of the results we can await. Later we have used better model with the more realistic electron distribution.
Assumptions of the simple model • Initial state: Solar atmosphere corresponds to the model of an active region with a constant pressure (DEM of active region - CHIANTI, Vernazza & Reeves, 1978, ApJSS 37, 485). Particles have Maxwellian distributions with temperatures corresponding to the model. • Mono-energetic electron beam with density of 2.19108 cm-3 and velocity of 1.01010 cms-1 (electron energy 28.4 keV, beam energy flux 1.01011 erg cm-2 s-1 ) produces the return current. For the simplicity, we assumed that the return current is formed by all plasma electrons with the same drift velocity. This changes of the electron distribution function in the coordinate system of protons and ions. The influence of thermalization on plasma distribution is neglected. • The electron beam is present for a sufficiently long time to achieve the ionization and excitation equilibrium. The effect of possible pressure imbalance and subsequent plasma motions is ignored. • Three values of pressure (NeT = 3.51015, 7.01015 and 1.01016 cm-3K) have been supposed to change the influence of the electron beam on plasma.
Electron distribution function In the coordinate system connected with protons and ions, due to the return current the electron distribution is shifted to higher energy and gets more mono-energetic character comparing to the Maxwellian distribution. The changes increase with the increase of the ratio of electron beam density to electron plasma density. The computations were made by adding the corresponding electron drift velocity to all electrons. The changes in the electron distribution function due to return current in different layers of the solar atmosphere for 3 values of NeT. The initial temperature of each atmospheric level is mentioned in the title of the figures and Maxwellian electron distribution corresponding to this temperature is shown by black line in all figures.
Atmospheric response Differential emission measure (DEM) describes the contribution of particular atmospheric layers with given temperature to final spectrum. The pseudo-temperature has the same relation to the mean energy of distribution as the temperature in Maxwellian distribution. We have used pseudo-temperature to describe the non-thermal distribution in terms similar to the Maxwellian distribution. The changes in the mean energy of distribution due to the return current are very small in the lower part of transition region. Distinguishable changes are in the higher part of transition region and the largest changes are in the solar corona where the pseudo-temperature of plasma can reach the values which are typical for the solar flares. The effect of the electron beam is the largest in transition region. The changes in the solar atmosphere due to the return current for 3 values of NeT. The full black line shows the initial atmosphere. The changes in the atmospheric structure increase with the increase of the ratio of the electron beam density to electron density in plasma, Ne.
Ionization equilibrium • The approximations of the ionization and autoionization cross sections (C, N, O, Ne, Mg, Al, Si, S, Ar, Ca, Fe and Ni) have been taken from Arnaud and Rothenflug, 1985, A&ASS 60, 425. The cross sections have been integrated over the non-thermal distribution function to get the ionization rates. The ionization by the electron beam has been included into the ionization rates. • The recombination rates for the non-thermal distribution have been computed by using the approximation technique described in Dzifcakova, 1992, SP 140, 247. The contribution of the electron beam to the recombination rate can be neglected. • The contribution of the electron beam to the ionization rate can be very important. The ionization state can correspond to the much higher temperature than the temperature or pseudo-temperature of plasma including return current only is. • The presence of the electron beam affects the ionization equilibrium in the transition region in similar way as the non-thermal distribution with enhanced number of particles in high energy tail: at the same time we can observe more ions in high abundances in comparison with Maxwellian distribution. • The non-thermal plasma distribution in the corona originated due to the return current has an opposite effect on the ionization equilibrium as the electron beam has. The combination of both effects results in practically Maxwellian ion abundances in solar corona.
Ionization equilibrium The changes in the ionization equilibrium due to the return current and electron beam in different layers of solar atmosphere for 3 values of NeT. The initial temperature in each atmospheric layer is mentioned in the title of the figures and the abundances of Fe ions for Maxwell electron distribution corresponding to that temperature are shown by full black line in all the figures. The gray line shows the Fe abundances for Maxwellian distribution with temperature at which the particular ion has the abundance maximum as has the same ion in the non-thermal distribution model with NeT= 3.51015 cm-3K.
Excitation equilibrium • The original modification of CHIANTI* software and database has been used for computation of the synthetic spectra. • The software and extended database now allows the computation of the excitation equilibrium and synthetic spectra under the assumption of non-thermal distributions and involves computation of satellite line intensities. • In the lower part of the transition region the changes in the EUV line intensities are influenced by the electron beammainly. The presence of the return current has too small effect on the shape of the electron plasma distribution and can not be diagnosed in neither of the 3 models of the atmosphere we have considered. • In the upper part of the transition region the situation is similar. Although the return current influences the electron distribution function significantly, we have not been able to separate its effect from the effect of the electron beam. * CHIANTI is a collaborative project involving the NRL (USA), RAL (UK), MSSL (UK), the Universities of Florence (Italy) and Cambridge (UK), and George Mason University (USA). The software is distributed as a part of SolarSoft.
The changes of the line intensities -the lower part of transition region The presence of the electron beam enhances the intensities of C IV 1548 Å and 1551 Å lines by several orders. These lines are sensitive on the presence of magnetic fields and their enhanced intensities can be observed in the footpoints of the flaring loops (quasi-separatrices) during flare. The intensities of C IV 1548 Å and 1551 Å lines in an active region (left) and their enhancement due to the electron beam and the return current for the atmosphere with NeT= 3.51015 cm-3K (right).
The changes of the line intensities -the upper part of transition region The electron beam together with the return current enhances the intensities of many EUV lines in upper part of the transition region. The intensity enhancement is observed mainly in the spectral lines for which the blinkers and explosive events are observed: O III, O IV, O V, C III, C IV, Si IV... The intensities of the spectral lines in region 900 Å - 2000 Å for an active region (left) and their enhancement due to the electron beam and the return current for the atmosphere with NeT= 3.51015 cm-3K (right).
The changes of the line intensities -the solar corona The non-thermal distribution in the corona, as the result of the return current, is able to enhance the intensities of the satellite lines. Such enhancement is really observed during the impulsive phase of a solar flare and it is not possible to explain it using the Maxwellian distribution together with an appropriate DEM. We can say that if this kind of non-thermal distribution is a result of the return current, we can diagnose it. The comparison of the synthetic spectrum for the Maxwellian distribution (right) with the spectrum produced by a return current and an electron beam (left). The model atmosphere with NeT= 3.51015 cm-3K was considered. The enhancement of the satellite lines Si XIId is clearly visible (right).
The changes of the line intensities -the solar corona The comparison of the RESIK X-ray spectra of the M4.9 solar flare on Jan 7, 2003 withthe synthetic spectrum for the flare DEM for Maxwellian distribution (left) with the spectrum produced by a return current and an electron beam (right).
Problems of our simple model • The mono-energetic electron beam. • No thermalization on plasma distribution • No dynamic effects. • .... • Thus, the more realistic model of the interaction of the electron beam with the plasma has been considered in new computation. • Beam parameters: electron velocity 1.01010 cms-1,electron energy 28.4 keV
The Electron Distribution with the Electron Beam and the Return Curent – Kinetic Model Electron distribution functions Times: wpet = 0, 100, 250, 2500 (TR)
The Electron Distribution Function black line: T0=2x10⁶K, nB:ne=1:10, full red line T0=1x10⁶K, nB:ne=1:10, full green line T0=2x10⁶K, nB:ne=1:20, dashed green line: Maxwell, T0=2x10⁶K, dashed red line: Maxwell, T0=1x10⁶K.
X-Ray Spectrum The character of the spectrum is not influenced by the initial temperature of plasma. The influence of the temperature on the spectrum: left: T0=1x10⁶K, nB:ne=1:10, right: T0=2x10⁶K, nB:ne=1:10
X-Ray Spectrum The character of the spectrum is determined by the ratio of the density of the electron beam to the initial plasma density. The influence of the ratio of the density of the electron beam to the plasma density on the spectrum: left: T0=2x10⁶K, nB:ne=1:10, right: T0=2x10⁶K, nB:ne=1:20
X-Ray Spectrum • For the modelled distribution: • the intensities of the Si XIII lines (5.28 Å, 5.40 Å) are higher for modelled distribution than for the Maxwellian distribution; • the intensities of the Si XIId satellite lines (5.82 Å, 5.56 Å) are lower. The comparison of the spectra: left: plasma with the return current and the electron beam ,T0=2x10⁶K, nB:ne=1:10, right: plasma with the Maxwellian electron distribution,T0=1.29x10⁷K.
X-Ray Spectrum The comparison of the spectra: left: plasma with the return current and the electron beam ,T0=1x10⁶K, nB:ne=1:10, right: plasma with the Maxwellian electron distribution,T0=8.51x10⁶K.
Why we have got different results? • the intensities of the satellite lines depend on the number of particles with the energy of the transition; • the intensities of the allowed lines are integrals of the product of the cross section with the velocity over a distribution from the excitation energy. The explanation: the different gradient of distributions in presented and previous model. green line: T0=2x10⁶K, nB:ne=1:10, red line T0=1x10⁶K, nB:ne=1:10, blue line T0=2x10⁶K, nB:ne=1:20, dashed green line: Maxwell, T0=2x10⁶K, dashed red line: Maxwell, black line: previous simple model, distribution plus mono-energetic beam, T0=2x10⁶K, thin black lines: excitation energy of Si XIId 5.82 Å and Si XIII 5.68 Å.
Comparison of the models • previous model: all electrons have drift velocity • presented model: only a part of electrons have drift velocity to carry the return current in plasma bulk (RCB) and the second part of electrons caries the return current in the high energy tail of the distribution (RCT). The wave interaction between the electron beam and ambient plasma heats plasma and decreases the gradient of the distribution. • The gradient of the electron distribution is steeper if the drift velocity in plasma bulk is higher: • T0 nB:ne RCB RCT • 1x10⁶K 1:10 31% 69% • 2x10⁶K 1:10 25% 75% • 2x10⁶K 1:20 23% 77% • The most suitable conditions to get the similar distribution shape as in the simple model are for higher T0 and lover nB:ne.
Conclusions • The electron beam together with the non-thermal electron distribution changes relative abundances of ions and intensities of the spectral lines. • Considerable enhancement of many EUV spectral lines in the transition region is produced by the electron beam with the return current. • We are still not able to separate the effect of the electron beam from the effect of the return current in the transition region. • The changes in the shape of the electron distribution function in solar corona depends on the initial temperature and the ratio of the density of the electron beam to the initial plasma density. • The presence of the electron beam (or distribution with enhanced number of particles in high energy tail) is able to change the ratio of the intensities of spectral lines. • The presence return current in the solar corona influence the intensities of the satellite lines by different way what gives possibility to diagnose it.
Thank you very much for your attention Ďakujem za pozornosť