Evolutionary Divergence in Bt2 and Zea mays 2 Genes After Duplication
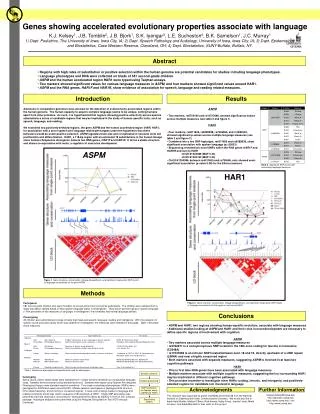
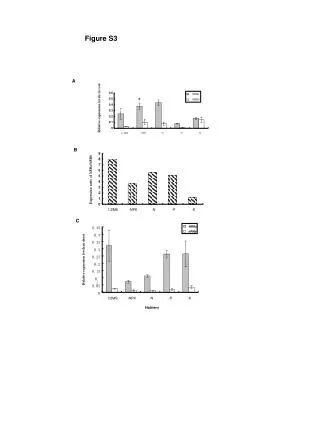
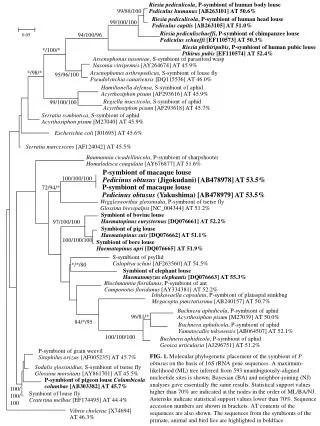
Differential evolution rates of Bt2 and Zea mays 2 genes post duplication, illustrated in a phylogenetic tree. Branch lengths indicate amino acid substitutions per site, estimated with AAML. Expression tissues and amino acid substitution numbers are highlighted.

Evolutionary Divergence in Bt2 and Zea mays 2 Genes After Duplication
E N D
Presentation Transcript
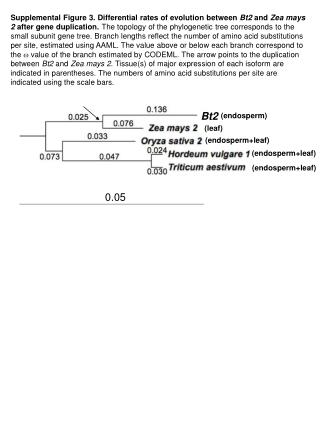
Supplemental Figure 3. Differential rates of evolution between Bt2 and Zea mays 2 after gene duplication. The topology of the phylogenetic tree corresponds to the small subunit gene tree. Branch lengths reflect the number of amino acid substitutions per site, estimated using AAML. The value above or below each branch correspond to the value of the branch estimated by CODEML. The arrow points to the duplication between Bt2 and Zea mays 2. Tissue(s) of major expression of each isoform are indicated in parentheses. The numbers of amino acid substitutions per site are indicated using the scale bars. Bt2 (endosperm) (leaf) (endosperm+leaf) (endosperm+leaf) (endosperm+leaf) 0.05