Download
1 / 41
410 likes | 522 Views
The Determinants of Municipal Solid Waste. Consumption. · 16% of population consumes 80% of natural resources · 25 tons of raw materials per American · The U.S. (1/25 of world population) operates 1/3 of the world’s automobiles and

E N D
Consumption ·16% of population consumes 80% of natural resources · 25 tons of raw materials per American ·The U.S. (1/25 of world population) operates 1/3 of the world’s automobiles and consumes 1/4 of the global energy supply
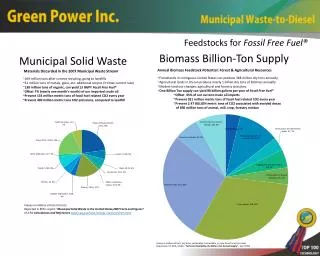
Consumption Begets Waste ·1986: 3.66 lbs of MSW per person per day ·2009: 4.34 lbs ·More municipal solid waste per capita than any other OECD country
Problems with Waste ·Resource Depletion ·Scarcity of Storage Sites ·External Costs ·Reflections of Larger Societal Inefficiencies
·24% of MSW is from non-renewable resources ·33.4% of MSW is “recovered” for recycling or composting
Scarcity of Storage Sites 1988: 8000 landfills in the U.S. 2008: 2122 • Urban sprawl makes convenient sites less viable • Waste transport has high $ and enviro cost • Groundwater contamination or adverse trends at 90% of land fills • Ash toxicity problems at incineration facilities (17% of MSW is incinerated)
Reflections of Larger Societal Values?1970s • 12 percent increase in per-capita waste generation
1980s “Theme! Me! Me! generation of status seekers. ‘If you've got it, flaunt it,’ ‘Shop Til you drop,’ and ‘You can have it all!’ were catchphrases. Binge buying and credit became a way of life. Labels were everything. Tom Wolfe dubbed the baby-boomers as the ‘splurge generation.’” --Kingwood college website on American cultural history 34 percent increase in per-capita waste generation
1990s and 2000s No Change
Demographic Trends may affect Levels of Waste ·74 LDC’s will double in population size over the next 25 years. ·World population grows by about 78 million each year. ·Materialism may be increasing
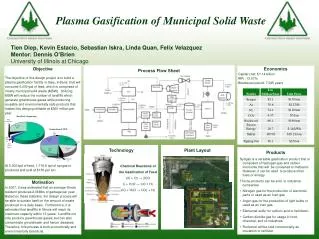
Question: Which trends pose the greatest threats?Definitions and Data The U.S. Census Bureau defines municipal waste as: “That which is collected and treated by or for municipalities: household waste and bulky waste as well as comparable waste from small communities or industrial enterprises; and market and garden residue.”
Data are from mid 1990’s • 1055 U.S. counties in 17 states • Figures are for waste disposed of (generation net of reclamation)
Log Waste Equation With Income Variable R2 = 0.119, Adj. R2 = 0.111
SOLUTIONS • Awareness • Education • Alternatives • Incentives • Social Motivation