2010 Toward Zero Deaths Conference
310 likes | 489 Views
2010 Toward Zero Deaths Conference. Rural ITS Safety October 25 – 26, 2010. Thomas A. Sohrweide , PE, PTOE SEH Inc. Problem. Minnesota Motor Vehicle Crash Facts, 2009 421 fatalities 31,074 injuries Rural areas account for 2 out of 3 fatalities 2009 crashes cost Minnesota $1.5 billion.

2010 Toward Zero Deaths Conference
E N D
Presentation Transcript
2010 Toward Zero Deaths Conference Rural ITS Safety October 25 – 26, 2010 Thomas A. Sohrweide, PE, PTOE SEH Inc.
Problem • Minnesota Motor Vehicle Crash Facts, 2009 • 421 fatalities • 31,074 injuries • Rural areas account for 2 out of 3 fatalities • 2009 crashes cost Minnesota $1.5 billion
Underlying Causes • In Single Vehicle Crashes • Illegal or unsafe speed contributing factor most often cited for all drivers • In Multiple Vehicle Crashes • For drivers through age 64 – driver inattention or distraction most often cited • Failure to yieldsecond most common • Over Age 65 Pattern Reverses • Failure to yieldmost common • Driver inattention or distraction second most common
Driving Conditions • Most Crashes Occur in Good Driving Conditions • 60% of fatal and 68% of nonfatal occur during daylight hours • Good Weather Conditions • 66% of fatal and 55% of nonfatal – “clear” weather • Road Surface Condition for Fatal Crashes • Usually “good” • 26% on wet roads, snowy, icy roads
Goal To develop low-cost, readily deployable, low maintenance systems that can be used to improve safety on rural roadways.
Rural ITS Safety • Rural ITS Safety Solutions – Mn/DOT Innovative Idea Project • Driver Behavior Evaluation System (DBES) • Stop Sign Warning System (SSWS) • Curve Warning System (CWS) • Intersection Collision Warning (ICW) Systems
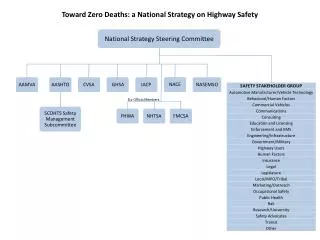
Project Team • Mn/DOT – OTST • Mn/DOT Metro District • Mn/DOT District 4 • US DOT - FHWA • Minnesota Counties • Freeborn County • Hennepin County • McLeod County • Olmsted County • Otter Tail County • Washington County • Wright County • SEH / NTT • Independent Evaluation Consultant (Iteris)
Project Deliverables • Concept of Operations • System Requirements • System Design • Laboratory Test • Field Operational Test • Evaluation
Solar Solar Fault Indicator Radar SIGN Controller Communications (Radio) Controller User Interface Communications (Radio) Battery Battery System Configurations Detection Node Warning Node
Driver Behavior Evaluation System Concept • Need to know exactly what the problem is: • System to provide reliable data • Driver behavior underlying the problem • At rural intersection stop signs • Behavior of driver approaching stop sign • Behavior of driver on through road • Speed profiles • At horizontal curve • Behavior of driver approaching curve • Speed profile
Driver Behavior Evaluation System • Hardware • Doppler radar • GPS receiver • Data logger • Battery powered with life of 3 weeks • Up to 4 devices to cover 4-way intersection • Single device to cover each approach to a curve • Software • Analysis and reporting strategies
Driver Behavior Evaluation System Olmsted County, MN TH 42/CSAH 9
Driver Behavior Evaluation System Data Preliminary Data taken from DBES in Wright County
Stop Sign Warning System Concept • Radar-based detection to monitor speed profile of vehicle approaching a stop sign • Provide a flashing warning of the stop based on speed • Within normal stop profile – No warning • Excessive speed detected – flashing lights to alert driver
Stop Sign Warning System • Hardware • Doppler radar • Wireless link • Controller • Flasher stop sign • Fault notification • Software • Speed/distance data algorithm to set parameters • Determine spatial position of the vehicle • Activate flashers On-Site Fault Notification Device
Stop Sign Warning SystemDesign • Deceleration Rate = 14.8 ft/s2 • Perception / Reaction Time • Maximum Approach Speed Design = 80 mph • Duration of Flash = Detection Speed / 14.8 ft/s2 • Enhance Border of Near Right Stop Sign
Stop Sign Warning SystemWashington County, MNCR 64 (McKusik Rd)/ CSAH 15 (Manning Ave)
Stop Sign Warning SystemWashington County, MNCR 64 (McKusik Rd)/ CSAH 15 (Manning Ave)
Curve Warning SystemConcept • Radar-based detection to monitor speed profile of vehicle approaching a horizontal curve • Provide a flashing warning of the curve ahead based on speed • Within normal stop profile – No warning • Excessive speed detected – flashing lights to alert driver
Curve Warning SystemDesign • Deceleration Rate = 14.8 ft/s2 • Perception / Reaction Time • Design for Curve Entry Speed = 47 mph • Maximum Approach Speed Design = 75 mph • Enhance Chevron Signs 3, 4, 5, and 6 • Duration of Flash = 4 seconds from curve entry (50 mph to Sign 5 from Curve Entry)
Safe Intersections • Develop, test, and implement 3 to 5 Intersection Collision Warning (ICW) Systems • Commercial Off the Shelf (COTS) technology
Evaluation Test Plans • Safety Impacts • Owner Satisfaction • User Perception • Performance
Current Status • DBES field test pending • CWS activated • SSWS will be activated within the next 2 weeks • ICW • Conducted a vendor showcase • Completed Con Ops • Preparing System Requirements
Questions ? Tom Sohrweide SEH Inc. 651.490.2072 tsohrweide@sehinc.com