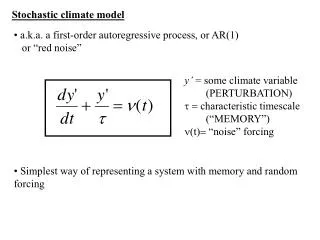
Stochastic climate model
Stochastic climate model. a.k.a. a first-order autoregressive process, or AR(1) or “red noise”. y’ = some climate variable (PERTURBATION) t = characteristic timescale (“MEMORY”) n( t )= “noise” forcing. Simplest way of representing a system with memory and random

Stochastic climate model
E N D
Presentation Transcript
Stochastic climate model • a.k.a. a first-order autoregressive process, or AR(1) • or “red noise” • y’ = some climate variable • (PERTURBATION) t = characteristic timescale (“MEMORY”) n(t)= “noise” forcing • Simplest way of representing a system with memory and random • forcing
But can write: So:
In discretized form (i.e., time stepping in increments of Dt): a1 = 1- Dt/t. nt = noise - a random event, (normalized) a0 = amplitude of noise. current state memory random forcing This is called a first order autoregressive process , or AR(1) Also known as ‘red noise’ process The element of random noise makes it a stochastic process
What is noise? Ex: Daily maximum temperature at SeaTac airport in 2002:
Anomalous temperature • Now consider departure from normal (i.e., remove the annual cycle)
Histogram of anomalies • Temperatures are most likely to be near normal, but there are a • few days with extreme departures from normal.
Stochastic models with different characteristic timescales t = 0 yrs No memory (uncorrelated) t = 1 yrs t = 5 yrs t = 25 yrs Long memory Time (yrs) • The greater the memory, the longer the timescale of the variability (i.e., length of interval above or below average).
What does the spectrum of variability look like? How does the power (or energy) in the time series vary as a function of frequency (or period)? t = 0 yrs (no memory) Time Series Time (yrs) Power spectrum Power For no memory, energy Is the same at all periods (frequencies). Hence ‘white noise’. Period in years (i.e. 1/frequency) note the log scale.
What does the spectrum of variability look like? How does the power (or energy) in the time series vary as a function of frequency (or period)? t = 1 yrs Time Series Time (yrs) Power spectrum Power Increased memory increases power at longer periods: hence “red” noise Period in years (i.e. 1/frequency) note the log scale.
What does the spectrum of variability look like? How does the power (or energy) in the time series vary as a function of frequency (or period)? t = 5 yrs Time Series Time (yrs) Power spectrum Power Increased memory increases power at longer periods: hence “red” noise Period in years (i.e. 1/frequency) note the log scale.
What does the spectrum of variability look like? How does the power (or energy) in the time series vary as a function of frequency (or period)? t = 25 yrs Time Series Time (yrs) Power spectrum Power Increased memory increases power at longer periods: hence “red” noise Period in years (i.e. 1/frequency) note the log scale.
Equation for power spectrum of a red noise process P(f) = power per unit frequency, f See, e.g., Jenkins and Watts, 1968 • Can also show (how?) thathalf the energy in the time series • occurs at periods which are 2pt or longer. By analogy: Pendulum time constant = l = length of string g = gravity Period of oscillation =
Because any geophysical system at all will always have random noise, and some inertia (a tendency to remember previous states), red noise should always be the default expectation Example from last time: Pacific Decadal Oscillation. Even though variability is decadal, time series consistent with a red noise process with a timescale of ~1 yr.
PDO index (top panel) compared to 2 random realizations of a an AR(1) process with a characteristic time scale of 1.2 years -note the apparent cycles