Download
1 / 15
150 likes | 317 Views
An Overview of the Total Lightning Jump Algorithm: Past, present and future work. Christopher J. Schultz 1 , Walter A. Petersen 2 , Lawrence D. Carey 3* 1 - Department of Atmospheric Science, UAHuntsville , Huntsville, AL 2 – NASA Marshall Space Flight Center, Huntsville, AL

E N D
An Overview of the Total Lightning Jump Algorithm: Past, present and future work Christopher J. Schultz1, Walter A. Petersen2, Lawrence D. Carey3* 1 - Department of Atmospheric Science, UAHuntsville, Huntsville, AL 2 – NASA Marshall Space Flight Center, Huntsville, AL 3 – Earth System Science Center, UAHuntsville, Huntsville, AL
The Foundation • Goodman et al. (1988) demonstrated that total lightning peaked prior to the onset of a microburst. • Williams et al. (1989) showed that the peak total flash rate correlated with the maximum vertical extent of pulse thunderstorms, and preceded maximum outflow velocity by several minutes. • MacGorman et al. (1989) showed that the total flash rate peaked 5 minutes prior to a tornado touchdown, while the cloud-to-ground (CG) flash rate peaked 15 minutes after the peak in intra cloud flash rate. Adapted from Goodman et al. (1988) Adapted from MacGorman et al. (1989)
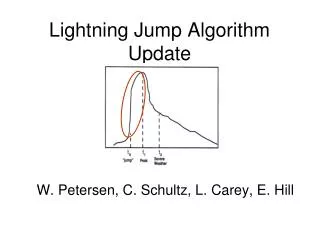
Previous work:lightning jumps • Williams et al. (1999) examined a large number of severe storms in Central FL • Noticed that the total flash rate “jumped” prior to the onset of severe weather. • Williams also proposed 60 flashes min-1 or greater for separation between severe and non-severe thunderstorms. Adapted from Williams et al. (1999) (above)
The Lightning Jump Framework • Gatlin and Goodman (2010) , JTECH; developed the first lightning jump algorithm • Study proved that it was indeed possible to develop an operational algorithm for severe weather detection • Mainly studied severe thunderstorms • Only 1 non severe storm in a sample of 26 storms Adapted from Gatlin and Goodman (2010)
Schultz et al. (2009), JAMC Thunderstorm breakdown: North Alabama – 83 storms Washington D.C. – 2 storms Houston TX – 13 storms Dallas – 9 storms • Six separate lightning jump configurations tested • Case study expansion: • 107 T-storms analyzed • 38 severe • 69 non-severe • The “2σ” configuration yielded best results • POD beats NWS performance statistics (80-90%); • FAR even better i.e.,15% lower (Barnes et al. 2007) • Caveat: Large difference in sample sizes, more cases are needed to finalize result.
Schultz et al. 2011, WAF • Expanded to 711 thunderstorms • 255 severe, 456 non severe • Primarily from N. Alabama (555) • Also included • Washington D.C. (109) • Oklahoma (25) • STEPS (22)
Understanding Limitations Nearly 40% of misses in Schultz et al. (2011) came from low topped supercells, TC rainband storms, and cold season events - Lack of lightning activity inhibited the performance of the algorithm Time-height plot of reflectivity (top) and total flash rate (bot) for an EF-1 producing tornadic storm on March 25, 2010. Tornado touchdown time ~2240 UTC.
Examined Several Methods • Radar based • 35 dBZ at 6 km • 35 dbZ and 45 dBZ at 3 km • 35 dBZ and 50 dBZ at 3 km • 35 dBZ at 0°C • Lightning based (flash extent density) • 3 flashes km2 • 3 and 5 flashes km2 dual threshold • 3 and 6 flashes km2 dual threshold • Have also tested different area thresholds as, temporal periods, and have utilized smoothing and clumping, and tested at GLM resolution • Several more planned, as well as combinations of lightning, radar and satellite.
The Good • We can track isolated storms very well for long periods of time using total lightning • Do not have as many issues with merging and splitting of dBZ cores Quarter to tea cup size Hail Observed from 0430 UTC – 0450 UTC H H H H H H
Trends still there Same hailstorm as the last time, just with a comparison to GLM resolution.
Obviously we lose smaller features By moving to a GLM like resolution, we lost individual convective areas within a line. - Solution: move to a flash density product instead of an FED product. Individual tornadic cells within a line Midday tornadic QLCS, 27 April, 2011
System IssuesMay 26, 2011, 0356-0554 UTC Number of stations contributing to the flash extent density can cause a “blooming” effect which would affect the FED thresholds used to track storms.
What still needs to be done • Develop an accurate cell tracking method • Several proposals to explore this, work already being undertaken • Test in an operational setting • Spring experiment proposal • Develop algorithm for Geostationary Lightning Mapper datastream • i.e., transition from LMA tailored product to a GLM tailored product • Get operational forecasters to buy in! • Show timing of lightning jumps to radar and satellite parameters (e.g., Deierling et al. 2008, Johnson 2008).