Download
1 / 46
460 likes | 554 Views
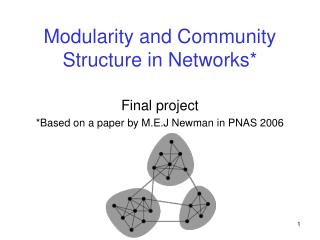
Community Structure in Social and Biological Network. N. Girvan and M. E. Newman. Presented by Attila Altay YAVUZ. Introduction.

E N D
Community Structure in Social and Biological Network N. Girvan and M. E. Newman Presented by Attila Altay YAVUZ
Introduction • A number of recent studies have focused on the statistical properties of social, biological and WWW networks such as small world, power-low degree distribution and network transitivity (connectivity). • In this paper, another property that is found in many networks,community structure, has been studied. • Property of community structure is that nodes of the network in within group are joined together in tightly knit groups while their between groups are only loosely connected.
Motivations • The ability to detect community structure in a network could clearly have important benefits. • Communities in a social network might represent real social groupings, perhaps by interest or background. • Communities in a citation network might represent related papers on a single topic. • Communities in a metabolic network might represent cycles and other functional groupings. • Communities on the web might represent pages on related topics. • Being able to identify these communities could help us to understand and exploit these networks more effectively.
Content of the Presentation Detection Weight forCommunity Structure • Detection Weight forCommunity Structure • Traditional Methods • Weight definitions • Max-Flow Based Method • Converging Weight Method • Edge Betweenness and Community Structure • GN Algorithm • Analysis of GN Algorithm • Tests of the Methods • Applications • Conclusion Edge Betweenness and Community Structure GN Algorithm Analysis of GN Algorithm Tests of the Methods Applications Conclusion
Community Structure • Community structure is sometimes called clustering, but it does not refer to clustring or network transitivity. • Generally, social networks having subsets of vertices within which vertex–vertex connections are dense, but between which connections are less dense.
ANetwork with Community Structure • In this network, there are three communities of densely connected vertices(circle with solid lines), with a much lower density of connections(gray lines) between them
Detecting Community Structure • Traditional Methods: • Traditional method for detection community structure is hierarchical clustering. • One first calculates the weight Wi,jfor every pair of i,j of vertices in the network. • This represents in a sense how vertices are closely connected.
Traditional Method • With weights, n vertices in the network, with no edges between them are initialized. • Edges are added between pairs one by one in order of their weights, starting with the pair with strongest weight and progressing to the weakest. • As edges are added, the resulting graph shows a nested set ofincreasingly large components which are taken to be the communities. • In this graph, the lowest level at which twovertices are connected represents the strength of the edge thatresulted in their first becoming members of the same community.Trees of this type are sometimes calleddendrograms.
A dendrogram An example of small hierarchical tree. The circles at thebottom represent the vertices in the network, and the tree shows the order inwhich they join together to form communities for a given definition of theweight Wijof connections between vertex pairs.
Determining Weights • Many different weights calculation method have been proposed for use with hierarchical clustering algorithms. • One possible definition of the weight is the number of node-independent path between vertices. • Two paths that connect the same pair of vertices are said to be node-independent if they share none of the same vertices other than their initial and final vertices.
Node-Independend Paths 3(2 without initial) Paths
Edge-Independent Path • It is also possible to use Edge-Independent path. • Edge-independent paths between two vertices i and j in a graph is equal to the minimum number of vertices (edges) that must be removed from the graph to disconnect i and j from one another. • Thus these numbers are in a sense a measure of the robustness of the network to deletion of nodes.
Implementation of the Independence Path Method • There are possible polynomial-time algorithms to calculate independent path in a network. • Two of them are: • Max-Flow Algorithm • Augmenting Path Algorithm
Converging Weights(1) • To define weights between vertices is tocount the total number of paths that run between them (allpaths, not just those that are node- or edge-independent).Possible infinite loops or VLSG(very large scale graph) may cause infinite path number which make solution impossible. • Offered solution is linear algebra based. Sum of the path number should converge to reach solution. • If A is theadjacency matrix of the network, then the using a coefficient weightsin this definition are given by the elements of the matrix. • To satisfy this condition, one weights paths of length l by a factor α that is small with α^l so that weighted paths of the number of the path converges. • Thus long paths contribute exponentially less weight than those that are short. • For the sum to converge, we must αchoose smaller than the reciprocal of the largest eigenvalue of A.
Formulation of Convergence Using the Norm Matrix Theory Solve Non_Generalized Eigenvector for A V = λ V [U,V] = eig(A); Alfa < = Max( abs(U) );
Analysis of Weight Calculation • Both method have a tendency to separate single peripheral vertices from the communities to which they should rightly belong. If a vertex is, for example, connected to the rest of a network by only a single edge then, to the extent that it belongs to any community. • It is undesirable that single nodes often remain isolated from the network when the communities are constructed.Poor analysis of the network. • Poor results from these methods in well known networks make the hierarchical clustering method, although useful, far from perfect.
Edge ‘‘Betweenness’’ andCommunityStructure • Edge Betweenness is an alternative approach to the detection of the communities. • Instead of trying to construct a measure that tells us which edges are most central to communities, it is focused on those edges that are least centralor the edges that are most ‘‘between’’ communities. • Rather than constructing communities by adding the strongest edges to an initially empty vertex set, the original graph is constructed by progressively removing edges from it.
Computing Edge Betwenness • Edge betweenness has been studied in the past as a measure of the centrality and influence of nodes in networks • To find which vertexesin a network are most between other pairs of vertices, Freeman’s betweenness centrality is generalized to edges • Define the edge betweenness of an edge as the number of shortest paths between pairs of vertices that run along it. • If there is more than one shortest path between a pair of vertices, each path is given equal weight.
Computing Edge Betwenness • If a network contains communities or groups that are only loosely connected by a few intergroup edges, then all shortest paths between different communities must go along one of these few edges. • Thus, the edges connectingcommunities will have high edge betweenness. • By removingthese edges, we separate groups from one another and so revealthe underlying community structure of the graph.
GN Algorithm 1.Calculate the betweenness for all edges in the network. 2. Remove the edge with the highest betweenness. 3.Recalculate betweennesses for all edge affected by the removal. 4.Repeat from step 2 until no edges remain. 1.Calculate the betweenness for all edges in the network Remove the edge with the highest betweenness. Recalculate betweennesses for all edges affected by the removal. 4.Repeat from step 2 until no edges remain.
Analysis of GN Algorithm • To improve performance, the betweennesses can be calculated by using the fast algorithm of Newman , which calculates betweenness for all m edges in a graph of n vertices in time O(mn). • Because this calculation has to be repeated once for the removal of each-edge, the entire algorithm runs in worst-case timeO(m^2 n). • However, after the removal of each edge, we only have to recalculate the betweennesses of those edges that were affected by the removal, which is at most only those in the same component as the removed edge. This means that running time may be better than worst-case for networks with strong community structure
Alternative Improvements • To try to reduce the running time of the algorithm further, one might be tempted to calculate the betweennesses of all edges only once and then remove them in order of decreasing betweenness. • However, It is found that this strategy does not work well, because if two communities are connected by more than one edge, then there is no guarantee that all of those edges will have high betweenness—we only know that at least one of them will.
TESTS OF THE METHOD • Algorithm is tested by different methods such as computer generated graphs and real-world networks. • Examples of the real-world networks are: • Zachary’s Karate Club • College Football Team
Computer-Generated Graphs • To test the performance of GN algorithm it has been applied on a large set of artificial, computer generated graphs similar to those depicted in first figure. Each graph was constructed with 128 vertices divided into four communities of 32 vertices each. • Edges were placed between vertex pairs independently at random, with probability Pin for vertices belonging to the same community and Pout for vertices in different communities. Average degree of a vertex is z selected 16. • This produces graphs that have known community structure, but which are essentially random in other respects.
Computer-Generated Graphs • The algorithm performs nearly perfectly when zout < 6,”classifying 90% or more of the vertices correctly. Only for zout >= 6 does the fraction correctly classified start to fall off substantially. • In Fig. 3(squares) the fraction of vertices classified correctly by a standard hierarchical clustering calculation based on independent path counts computed by using max-flow. It is seen that the performance of this method is far inferior to that of GN method.
Fig. 3. The fraction of vertices correctly classified in computer-generatedgraphs of the type described in the text, as the average number of intercommunityedges per vertex is varied. The circles are results for the methodpresented in this article; the squares are for a standard hierarchical clusteringcalculation based on numbers of edge-independent paths between vertices.Each point is an average over 100 realizations of the graphs. Lines betweenpoints are included solely as a guide to the eye.
Zachary’s Karate Club Study • Zachary observed 34 members of a karate club over a period of 2 years. During the course of the study, a disagreement developed between the administrator of the club and the club’s instructor, which resulted in the instructor’s leaving and starting a new club, taking about a half of the original club’s members with him. • Zachary constructed a network of friendships between members of the club, using a variety of measures to estimate the strength of ties between individuals. • For implementation, a simple unweighted version of his network is applied on GN algorithm as an attempt to identify the factions involved in the split of club.
Zachary’s Karate Club Study Fig. 4a shows the network, with the instructor and the administratorrepresented by nodes 1 and 34, respectively. The friendship network from Zachary’s karate club study asdescribed in the text. Nodes associated with the club administrator’s factionare drawn as circles, those associated with the instructor’s faction are drawnas squares.
Zachary’s Karate Club Study 4b. Hierarchical tree showing the complete community structurefor the network calculated by using the algorithm presented in this article. Theinitial split of the network into two groups is in agreement with the actual factions observed by Zachary, with the exception that node 3 is misclassified.
Zachary’s Karate Club Study 4 c) Hierarchical tree calculated by using edge-independent path counts, which fails to extract the known community structure of the network.GN algorithm is clearly more accurate than this method.
Collage Football • Another real-world network example is a representation of the schedule of Division I games in USA: vertices in the graph represent teams (identified by their college names) and edges represent regular-season games between the two teams they connect. • It is interesting that network incorporates a known community structure. The teams are divided into conferences containing around 8–12 teams each. Games are more frequent between members of the same conference than between members of different conferences, with teams playing an average of about seven intraconference games and four interconference games in the 2000 season.
Application of the Method • After implementing algorithm on the known dataset and verify its accuracies, it will be used to analyze unknown complex and tangled dataset to extract their community structure. • First example is a collaboration network of scientists; second example is a food web of marine organisms in the Chesapeake Bay.
Collaboration Network • GN Algorithm has been applied to a collaboration network of scientists at the Santa Fe Institute, an interdisciplinary research center The 271 vertices in this network represent scientists during any part of calendar year 1999 or 2000 and their collaborators. • An edge is drawn between a pair of scientists if they coauthored one or more articles during the same time period. The network includes all journal and book publications, papers by the scientists involved.
Scientist Collaboration Diagram Fig. 6. The largest component of the Santa Fe Institute collaborationnetwork, with the primary divisions detected by GN algorithm indicated bydifferent vertex shapes.
Evaluation of the Scientist Collaboration Network • Algorithm splits the network into a few strong communities, with the divisions running principally along disciplinary lines. • The community indicated by diamonds is the least well defined.The algorithm further divides this group into smaller components that correspond roughly with the split between economics and traffic. • The community represented by circles is comprised of a group of scientists working on mathematical models in ecology and forms a fairly cohesive structure, as evidenced by the fact that the algorithm does not break it into smaller components to any significant extent.
Evaluation of the Scientist Collaboration Network • Scientists grouped together by similarity either of research topic or methodology. communities built around research topics; it is expected scientists to collaborate primarily with others with whom their research focus is closely aligned. • As an important example, the grouping of those working on economics with those working on traffic models may seem surprising, until one realizes that the technical approaches these scientists have taken are quite similar.
Food Web • The algorithm is applied on to a food web of marine organisms living in the Chesapeake Bay, a large estuary on the east coast of the United Statescontaining 33 vertices representing the ecosystem’s most prominent taxes. • The algorithm is also applied a number of other food webs.Interestingly, high correlation can not be obtain due to the some ecosystems are genuinely not composed of separate communities.
Food Web Fig. 7. Hierarchical tree for the Chesapeake Bay food web described in the text.
Evaluation of the Food Web • From the figure , the split between the two large communities corresponds quite closely with the division between pelagic organisms (those that dwell principally near the surface or in the middle depths of the bay) and benthic organisms (those that dwell near the bottom). • Results seem to imply that pelagic and benthic organisms in the Chesapeake Bay can be separated into reasonably self-contained ecological subsystems. The separation is not perfect: a small number of benthic organisms find their way into the pelagic community, presumably indicating that these species play a substantial role in the food chains of their surface-dwelling colleagues.
Conclusions • In this article community structure in various networks are investigated while introducing a method for detecting such structure. • Unlike previous methods that focus on finding the strongly connected cores of communities, GN works by using information about edge betweenness to detect community peripheries. • This method have been tested on computer-generated graphs and have been shown that it detects known community structure with a high degree of success. Method also have been tested on two real-world networks with well documented structure and find the results to be in excellent agreement with expectations.
Conclusion(2) • Moreover, two examples of applications of the algorithm was given to networks whose structure was not previously well documented and find that in both cases it extracts clear communities that appear to correspond to plausible and informative divisions of the network nodes. • A number of extensions or improvements of this method may be possible. • It isdesirable to generalize the method to handle both weighted and directed graphs. • It may be possible to improve the speed of the algorithm. At present, the algorithm runs in time O(n3) on sparse graphs, where n is the number of vertices in the network. This makes it impractical for very large graphs.
THANK YOU FOR LISTENING QUESTIONS?