Download
1 / 45
450 likes | 585 Views
The Health Impacts of Climate Change: The Evidence & The Uncertainty ”Francesca Dominici ” Harvard School of Public Health. The National Medicare Cohort Study, 1999- 2010 (MCAPS). Medicare data include: Billing claims for everyone over 65 enrolled in Medicare (~48 million people),

E N D
The Health Impacts of Climate Change:The Evidence & The Uncertainty”FrancescaDominici”Harvard School of Public Health
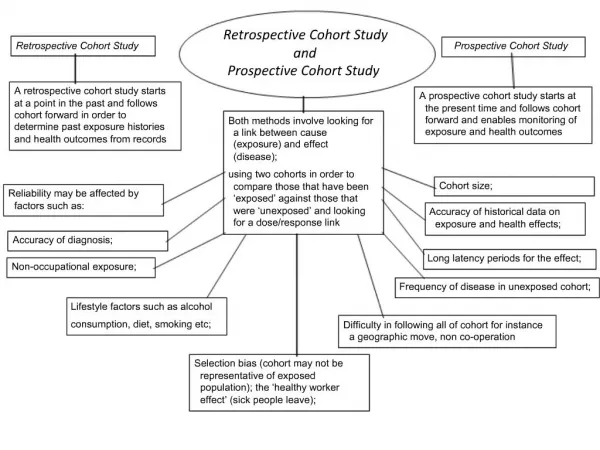
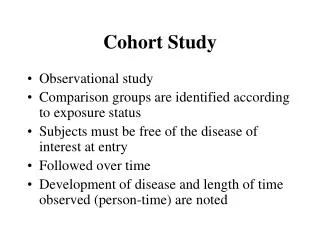
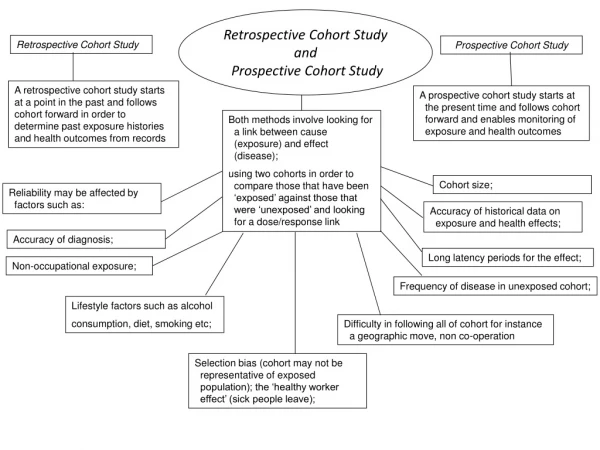
The National Medicare Cohort Study, 1999-2010(MCAPS) • Medicare data include: • Billing claims for everyone over 65 enrolled in Medicare (~48 million people), • date of service • disease (ICD 9) • age, gender, and race • place of residence (zip code)
Conducted by Dockery and Schwartz at HSPH National Morbidity Mortality Air Pollution Study 1987—2006
Statistical Model for Present-day Risk(May – October, 1987-2005) Age category-specific daily mortality model Expected age category-specific mortality count on day t Smooth functions of air pollution levels (ozone, PM), temporal trends Smooth spline function of temperature variables
Relative Risk Estimate Average number of deaths on heat wave days Average number of death on non-heat wave days Relative risk for individual age categories BMA
Analysis Schematic and Data Integration (Chicago, 1987—2005) (Chicago, 2081—2100)
Assumptions for Future Estimates • Constant heat wave relative risk over time • No adaptation to extreme heat • Constant rate of mortality on non-heat wave days • Minimal short-term mortality displacement
Are we becoming less vulnerable to heat? A national analysis of temporal changes in heat-related mortality in the USBobb, Peng,Bell, and Dominici
Mortality Data Obtained from the National Center for Health Statistics for the period 1987—2005 Death certificate data containing an individual’s date and cause of death, location of residence, age We construct a daily time series of mortality for non-accidental causes and different age categories Data are available for > 100 metropolitan areas
Present-day Temperature Data Hourly temperature and dew point temperature available from NOAA Maximum over a 24 hour period is used Maximum over multiple monitor values in a city is taken, if available
What is a Heat Wave? • There is no generally agreed upon definition of a heat wave • Exceedances of percentiles of the temperature distribution • Exceedances of specific absolute temperature levels • Continuous stretches of high temperature • High humidity
Heat Wave Definition • Threshold 1 (T1) is the 97.5th percentile of the distribution of daily maximum temperatures • Threshold 2 (T2) is the 81st percentile of daily max temperatures • A heat wave is defined as the longest period of consecutive days satisfying: • Daily max temp is above T1 for > 3 days • Daily max temp is above T2 for the entire period • Average of daily max temp over the period is > T1 Huth et al. 2000; Meehl & Tebaldi 2004
Accounting for Model Uncertainty in the temperature-mortality exposure-response
A National Study of Heat Waves and Mortality Log Relative Risks of Mortality and 95% HPD Associated with a Heat Wave Day: Results are shown for the largest 105 cities using data for the period 1987 to 2005. Results are grouped by geographical region and within each group are plotted as a function of the longitude (south to north) Bobb, Dominici, Peng, Biometrics 2011
Motivation • While the present-day health effects of hot temperatures have been fairly well characterized, the extent to which future changes in the heat wave distribution will affect human health has not been as extensively studied • We estimate the excess mortality associated with heat waves in Chicago for 2081– 2100 under several global climate change scenarios • We are interested in partitioning the uncertainty into: 1) statistical variation; 2) climate models, and 3) and climate change scenarios How will any change in the distribution of heat waves affect mortality and morbidity?
Heat Waves and Climate Change High/extreme ambient temperatures are associated with mortality and other health outcomes in the North America Will climate change affect the distribution of heat waves?
Expected number of excess deaths during a given heat wave period length of the heat wave period in days (estimated from future data) Expected number of excess deaths during a given heat wave period Expected daily number of deaths on a non-heat wave day (estimated from present-day data) Relative risk associated with heat wave days (estimated from present data) For Chicago there were 0.7 heat waves per year with an average length of 9.2 days (a total of 14 heat waves) during the period 1987-2005
Heat waves for the period 2081-2100 (IPCC, 2000) • Heat wave summary statistics for the 2081–2100 period were calculated using the CMIP3 multi-model daily maximum temperature output under the B1, A1B, and A2 scenarios • The A1 family of scenarios assumes rapid economic growth, an increase in world population until mid-century followed by a decrease, and the introduction of more efficient energy sources and conversion technologies. • The A1B scenario in particular assumes a mix of energy sources that is balanced across fossil fuel and alternative sources. • TheB1 scenario assumes a highly convergent world with moderate population growth (as with A1), a reduction in material intensity, and the introduction of clean and resource-efficient technologies. • The A2 scenario assumes a very heterogeneous world with little convergence between nations, regionally oriented economic development, and continuously increasing global population IPCC, SRES, 2000
Annual Number of Heat Waves and Average Length (in days) for Chicago, 2081—2100
Accounting for changing population growth and age structure • To estimate future excess mortality, we assumed the same non-heat wave rate of mortality as the 1987–2005 period and projected population growth using the B1, A1, and A2 age-stratified population estimates for the 2081-2100 (Lutz, 1996) • When computing the future excess mortality attributable to heat waves, we take into account the changing age structure of the population by applying age category-specific relative risks estimated from the age-stratified time series models.
Annual Heat Wave Mortality for Chicago, 2081—2100We estimated an annual excess mortality attributable to heat waves ranging between 166 to 2217 deaths per year Under the A2 scenario, 5 of the 7 climate models project that the annual mortality from heat waves will be similar to or greater than the mortality from the devastating 1995 heat wave. Peng, Bobb, Tebaldi, McDaniel, Bell, Dominici, EHP,2010
Future Directions • Methodology is reproducible across different locations using publicly available data • Look nationally at variation in heat wave risk across locations via hierarchical modeling • Look at morbidity effects of heat • Incorporate more realistic assumptions about the future (adaptation) • Examine time-varying risk, relate to other factors • Distributed lag may estimate the “total effect” of a heat wave better than single lag models (mortality displacement/harvesting)
Why the mortality risks are declining? • Higher AC prevalence does not automatically imply higher usage • Air Pollution Levels have declined • Prevention and treatment of cardiovascular diseases have improved • Extensive heat-health warning systems and public health response programs have been implemented in several US cities • Other factors that might contribute the to declining risk of heat-related mortality include: 1) changes in activity patterns (e.g., less time spent outside), changes in the built environment (e.g., more green spaces), physiological adaptations, and greater awareness of the dangers of extreme heat
Accelerated reaction rates Biogenic VOCs Known: Temperature Affects O3 Formation VOCs + NOx + heat / sunlight O3 Secondary pollutant Precursors to ozone
Mortality O3 November 17 2004
Ozone Levels Likely to Increase Bell et al. Climatic Change 2007
Forecasting fine particulate matter (PM2.5) across the United States in a changing climate Loretta J. Mickley Dominick Spracklen, Jennifer A. Logan, XuYue, Amos P.K.A. Tai, Daniel J. Jacob, Rynda C. Hudman Wildfires in Quebec the same day. Haze over Boston on May 31, 2010
Two constellations of studies Sensitivity of PM2.5 to changing meteorology in the East. Sensitivity of wildfires to changing climate in the West and the consequences for PM2.5.
2000-2050 climate change leads to increases in annual mean PM2.5 across much of the Eastern US. Models show increased duration of stagnation in the East, with corresponding increases in annual mean PM2.5. We use observed relationships + climate models, no chemistry models. Change in annual mean PM2.5 concentrations in 2050s relative to present-day Tai et al.2012 mg m-3
Particulate Matter and Health PM has been linked with health outcomes: hospitalization, mortality, decreased lung function, cardiac events Evidence of both short-term (acute) and long-term (chronic) effects of exposure to ambient PM Much recent work has examined ambient PM mass (PM10, PM2.5, PM10-2.5) indicator More studies now looking at health effects of PM constituents, sources
GCM Models • Atmospheric Chemistry • Statistical Models • Downscaling Climate Change Temperature PM2.5 Ozone Forest Fires Human Health Exposure Response Joint effects Adaptation Susceptibility
Co-Benefits (and Co-Costs) of Climate Change Policies • Many policies to improve air quality would lower GHG emissions. • Many policies to avoid/mitigate climate change would improve air quality in the short-term. Climate Change Policies Air Quality Policies Human Health
Relationship between Climate Change and Air Quality Policies Bell et al. Environmental Health 2008
Summary • What is known • Climate is changing • Health Impact of Extreme temperatures (e.g. heat waves) • Air pollution (especially O3) likely to be affected • What is not known • Changes in the pollutant mixture • Actual temperature levels (climate modeling) • Changing susceptibility/vulnerability • Changing adaptation (e.g., air conditioning) • Co-benefits (and co-costs) of policies
References • Bobb, J.F., F. Dominici, and R.D. Peng, A Bayesian model averaging approach for estimating the relative risk of mortality associated with heat waves in 105 U.S. cities. Biometrics, 2011. 67(4): p. 1605-16. • Dominici, F., et al., Fine particulate air pollution and hospital admission for cardiovascular and respiratory diseases. JAMA, 2006. 295(10): p. 1127-34. • Bell, M.L., et al., Ozone and short-term mortality in 95 US urban communities, 1987-2000. JAMA, 2004. 292(19): p. 2372-8. • Tai, A., et al., Meteorological modes of variability for fine particulate matter (PM2. 5) air quality in the United States: implications for PM2. 5 sensitivity to climate change. Atmos. Chem. Phys, 2012. 12: p. 3131-3145. • Barr, C.D. and F. Dominici, Cap and trade legislation for greenhouse gas emissions: public health benefits from air pollution mitigation. JAMA, 2010. 303(1): p. 69-70. • Peng, R.D., et al., Toward a quantitative estimate of future heat wave mortality under global climate change. Environ Health Perspect, 2011. 119(5): p. 701. • Zanobetti, A., O’Neill, M. S., Gronlund, C. J. & Schwartz, J. D. Summer temperature variability and long-term survival among elderly people with chronic disease. Proceedings of the National Academy of Sciences 1–6 (2012).
Expected number of deaths in a one-year period caused by all heat waves in that year • We calculated this summary by computing for every heat wave in the respective time period (1987–2005 for present day, 2081–2100 for future period), summing the excess deaths across all heat waves and dividing by the total number of years. • Using the daily maximum temperature output from each of the climate models, we calculated the number of heat waves per year and the length of each heat wave (in days) under a changing climate. • Averaging each of these numbers over the length of the study period and multiplying them together provided the expected number of heat wave days per year for each set of climate change scenarios and climate models.