Download

1 / 34
340 likes | 432 Views
Explore the impact of sector and market regressors on asset returns in the HAR-RV models. Analyze dispersion measures and significant regressors in sectors like Consumer Goods, Health Care, Financial, Basic Materials, and more.

E N D
HAR-RV Models Including Sector and Market Regressors Sharon Lee Spring 2009
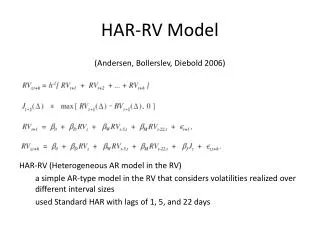
HAR-RV Models • 1) The original: • 2) Including sectors: • 3) Including market: • 4) Including market and sectors: RVt, t+h = ß0 + ßD RVt + ßW RVt-5, t + ßMRVt-22, t +εt+1 RVt, t+h = ß0 + ßD RVt + ßW RVt-5, t + ßM RVt-22, t + ßSD RVsector, t + ßSW RVsector, t-5, t + ßSMRVsector, t-22, t + εt+1 RVt, t+h = ß0 + ßD RVt + ßW RVt-5, t + ßM RVt-22, t + ßMD RVmkt, t + ßMW RVmkt, t-5, t + ßMM RVmkt, t-22, t + εt+1 RVt, t+h = ß0 + ßD RVt + ßW RVt-5, t + ßMRVt-22, t + ßSD RVsector, t + ßSW RVsector, t-5, t + ßSM RVsector, t-22, t + ßMD RVmkt, t + ßMW RVmkt, t-5, t + ßMM RVmkt, t-22, t + εt+1
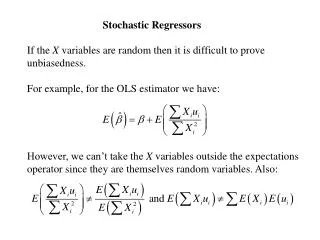
Dispersion • To take into consideration the associations between companies within a sector, and the associations between sectors in the market, we use cross-sectional dispersion measures of the asset returns (Solnik and Roulet 2000) • The dispersion measures can assess the existence of changing company and sector association through time • Cross-sector Dispersion • Cross-market Dispersion
Dispersion • Dt is the dispersion measure at time t • ritis the return of the ith company (or sector) • rwt is the sector (or market) return • This measure is based on the idea that companies are more associated with each other if the dispersion in the sector is low, and that they are less associated if the dispersion is high. This is similar for sectors in relation to dispersion in the market. • These dispersion measures are lagged as well so the fifth HAR-RV model • 5) RVt, t+h = ß0 + ßD RVt + ßW RVt-5, t + ßM RVt-22, t + ßSD RVsector, t + ßSW RVsector, t-5, t + ßSM RVsector, t-22, t + ßMD RVmkt, t + ßMW RVmkt, t-5, t + ßSMRVmkt, t-22, t + ßdsD Dsector, t + ßdsW Dsector, t-5, t + ßdsM Dsector, t-22, t + + ßdmD Dmkt, t + ßdmW Dmkt, t-5, t + ßdmW Dmkt, t-22, t+εt+1
Sector Data • Consumer Goods (12, n=2918) • Healthcare (9, n=2842) • Financial (10, n=2408) • Technology (14, n=2117) • Basic Materials (10, n=2264) • Industrials (5, n=2921) • Utilities (3, n=2036) • Conglomerates (4, n=2921) • Services (12, n=2223)
Sectors and Market • Stocks with less than 2000 observations were removed • Sector portfolios created are equally-weighted • Market: 79 stocks, 9 sectors (S&P100) • From 1997 to 2009 • Sampling frequency set at 5-min interval • Utilities, Industrials and Conglomerate sectors nixed from analysis because of small sample sizes
HAR-RV Model 5 DAY WEEK MONTH
Consumer Goods Sector • Across the time horizons, the number of significant regressors increases, so that the month horizon has the most significant regressors. • The consistently significant regressors are individual monthly, market daily, and market dispersion daily at the ‘***’ level (p-value < 0.001) • R-squared improvement is at least 20% over the original model. • The model provides the best fit at monthly period with 58.4%.
HAR-RV Model 5 DAY WEEK MONTH
Health Care Sector Analysis • Consistently significant (***) regressors are sector monthly, market daily, sector dispersion monthly, and market dispersion daily. • Model 5 shows huge improvement over Model 4, indicating the impact of adding the dispersion regressors. • As with the consumer sector, R-squared has the greatest improvement for Day and sequentially declines. • Best fit at week: 71.6%
HAR-RV Model 5 DAY WEEK MONTH
Financial Sector Analysis • Sector lagged regressors provide little explanation for stock RV prediction, while market regressors are highly significant for all three time horizons. • Model 5 shows greatest improvement over Model 4 for day and month, suggesting that dispersion factors provide insight for these time periods. • Week predictions are the best by far at about 60% R-squared, with dispersion not increasing Model 4 by much. • This may be related to the idea that low dispersion suggests high association between firms. • Best fit at week: 76.8%
HAR-RV Model 5 DAY WEEK MONTH
Basic Material Sector Analysis • Market dispersion factors for all time periods are significant for week and month though not day. • All market regressors are significant (***) at month period. • With the exception of sector daily, sector variables are not very significant. • Minimal improvement (~2%) with addition of dispersion factors. • Possibly indicates high association among basic material companies. • As with the financial sector, the greatest improvement is for the week horizon. • Best fit at week: 72.7%
Services AMZN Amazon.com BNI BURLINGTN N SANTE FE CBS CBS CORP CL B *not found CMCSA Comcast Corporation CVS CVS CAREMARK CP DIS WALT DISNEY-DISNEY C FDX FEDEX CORP HD HOME DEPOT INC MA MASTERCARD INC *less than 2000 observations MCD MCDONALDS CP NSC NORFOLK SO CP TGT TARGET CP TWX TIME WARNER INC *less than 2000 observations UPS UNITED PARCEL SVC
HAR-RV Model 5 DAY WEEK MONTH
Service Sector Analysis • This sector is puzzling. • Beyond the original HAR-RV with just the lagged single stock regressors, the models adding in sector, market and dispersion factors seem irrelevant. • It seems that information about the company provides the best prediction. • Best fit at week: 67.9%
HAR-RV Model 5 DAY WEEK MONTH
Tech Sector Analysis • The inclusion of dispersion factors are helpful in this sector. • Across all time horizons the improvement is considerable. • As with consumer and health care, the greatest improvement is for the day time period. • Best fit at week: 66.3%
Sector Generalizations • The improvement in models show that including dispersion increases the fit of the consumer, health care and technology sectors, with the most improvement in day and then progressively less improvement. • Financial, basic materials and service sectors show greatest improvement in the week period, but to a far less degree than the other three sectors for all time horizons.
Betas • Basic Materials: 1.19 • Financial: 1.50 • Service: 0.92 • Consumer Goods: 0.78 • Health Care: 0.66 • Technology: 1.1
Value-weighted Portfolios? • Intuitively, value-weighted portfolios should be more appropriate • Instead, of using equal-weighted portfolios for sector stocks and for the market, I ran the HAR-RV Model 5 with value-weighted portfolios • The market caps were used for each stock to calculate the new portfolios • Results: • Overall, using the value-weighted portfolios show adjusted R-squared values with minimal change compared to equally-weighted. • The fit is slightly worsened for almost all sectors and time horizons. Problem: Market caps are recent
Conclusions • Riskier and more volatile sectors tend to benefit most from additional regressors in the week period, and dispersion measures are only slightly beneficial. • For sectors with less risk, dispersion considerably helps the predictions. Also, the model improvements are greatest for the day period. • For all sectors, with the exception of consumer, the best fit was in the week period with an average R-squared of 68.6%.