Download
1 / 16
160 likes | 473 Views
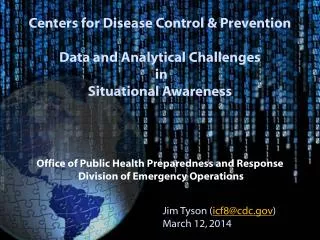
Centers for Disease Control & Prevention Data and Analytical Challenges in Situational Awareness. Office of Public Health Preparedness and Response Division of Emergency Operations . Jim Tyson ( icf8@cdc.gov ) March 12, 2014. SA Assessment Methodology . Social-Demographic Data.

E N D
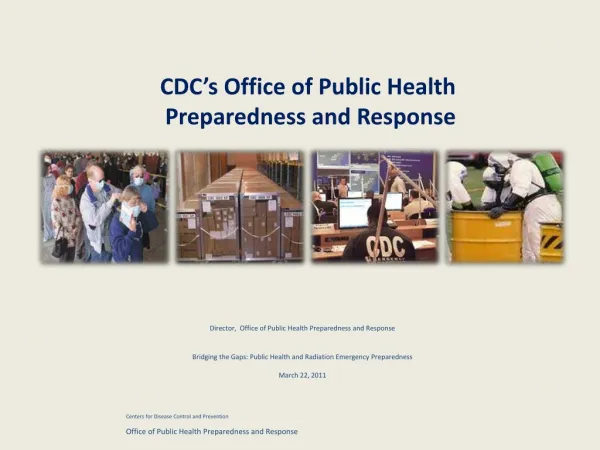
Centers for Disease Control & Prevention Data and Analytical Challenges in Situational Awareness Office of Public Health Preparedness and Response Division of Emergency Operations Jim Tyson (icf8@cdc.gov) March 12, 2014
SA Assessment Methodology Social-Demographic Data Ethnic – Tribe - Clan Socio-Economic • Resources • People • Material • -Information Religious Belief Language • Environment • Weather • Topographic • Geological • Disease Factors • -Flora, Fauna Political Affiliation • Assessments • Threats • Vulnerabilities • Hazards • Bio-Surveillance • Capabilities • Risks Critical Infrastructure Data Communications Public Health Critical Information Requirements (CIRs) Health Facilities Detect, Prevent, & Respond Logistics Buildings, Roads Power, Water,... • Communications • - Policy • Stakeholders • Schedules • Connectivity • -Risk Communication • -Clearance • Infrastructure • Roads • Transportation • Health Facilities • Utilities • Communications Physical, Environmental Data Weather, Imagery Hydrology Geographic location Topographic Flora, Fauna, Climate Public Health Indicators/Data Mortality; Morbidity Environmental; Microbial; Viral; Biological Signals; Health Care Capacity EPI/Disease Indicators
Public Health Metadata Layering Risk Assessment Weather, Water, Flora, Fauna, Geography Critical Infrastructure Demographics Environmental Disease Variables
The Problem Identify Locations of High Risk Populations for Vaccine Campaigns
Challenge • Using ½ meter panchromatic Satellite Images • Image extraction of settlements • Manual • CDC • Multinational Geospatial Co-production Program • Develop an Automated Methodology to Correlate Infrared Signals from NASA’s Visible Infrared Imaging Radiometer Suite (VIIRS) Satellite with Extracted Features From ½ Meter Satellite Imagery • Using Near-Infrared & Short wave Infrared to validate occupancy or use
“Stable lights” Temporary/Transient Lights Fig. 1 – Image from 06/11/13. White spots are locations where VIIRS detected an artificial light source. Fig. 2 – Image with “stable lights” overlaid from imagery taken from June – November 2013.
Fig. 3 – IR signals overlaid with surface features. Note: most light sources align with road networks and established cities.
Questions Office of Public Health Preparedness and Response Division of Emergency Operations Jim Tyson,, icf8@cdc.gov Jacqueline Burkholder, jib0@cdc.gov Bob Neurath, esi0@cdc.gov Department of Health and Human Services Centers for Disease Control and Prevention