Download

1 / 22
290 likes | 601 Views
Financial Time Series Forecasting by Neural Network. Palash Soni Y7027272. What is a Time Series. A time series is a sequence of data points, measured typically at successive times spaced at uniform time intervals. Example:- The Dow Jones Industrial Average. Financial Time Series.

E N D
Financial Time Series Forecasting by Neural Network PalashSoni Y7027272
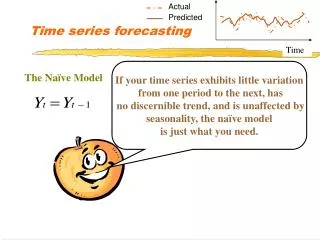
What is a Time Series A time series is a sequence of data points, measured typically at successive times spaced at uniform time intervals Example:- The Dow Jones Industrial Average
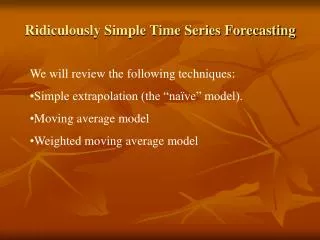
Financial Time Series Forecasting is done to earn profits!
Stock Market and Neural Networks • Stock Markets are governed by Time Series which are complex, non-linear, dynamic and chaotic • Neural Networks are better than other statistical methods available since they do not assume normality in the data
Alternative to the gradient descent- The conjugate gradient learning algorith Conjugate gradient method uses orthogonal and linearly independent non-zero vectors. Two vectors diand dj are mutually G -conjugate if Basic aim is to minimize the quadratic function:- An n dimensional vector An nxn symmetric and positive definite matrix
The Algorithm • Lets select a starting point w(1) randomly • The first search direction d(1)=-g(1), where g(1)=gradient[f(w(1))] • W(k+1)= W(k)+ α(k)d(k) • D(k+1)= -g(k+1)+β(k)d(k) • The challenge is to find α(k),d(k), β(k) • α(k) can be determined by line search techniques, like Golden search etc. in the way that the function f(w(k+1)) is minimized along the direction d(k) • β(k) can be calculated using non-linear conjugate gradient methods like:-
Once we have α(k), β(k), our next task is to find d(k+1) for the next iteration d(k+1) can be found out using inexact line searches like Shanno’s method For an n-dimensional quadratic problem, the solution converged from w(0) to w* by n steps moves along different d(n), However, for non-quadratic problems, G-conjugacy of the d vector deteriorates and so reinitialization is needed:-
The Algorithm Summarized To find w, s.t f(w)<e Calculate β(k), update d(k) >e <e Stop updating
In our case Actual output Desired output gradient Number of patterns in the training set
Replacement of Random Weight Initialization- Multiple Linear Regression Weight Initialization • In this, the weight between the input and hidden layer is initialized randomly but weights between hidden and output layer is obtained by multiple regression • The weight Wij between the input and the hidden layers are initialized by uniform randomization. Output of the hidden layer Activation function Inputs of sample ‘s’
Output Node Output at output node “Regressors” as weights Output at hidden layers Assuming f to be sigmoid Substituting f in the above equation:-
Simplification gives:- Vj’s can be obtained by standard regression method and henceforth, initialization is completed and training starts
Experiment-Inputs • Training data from 11 listed companies on Shanghai Stock exchange were taken • The first 500 data points were used for training and the next 150 were used for testing • Indicators are fed into the NN in place of raw data
Definitions of those indicators • EMA is a trend-following tool that gives an average value of data with greater weight to the latest data. Difference of EMA can be considered as momentum. • RSI is an oscillator which measures the strength of up versus down over a certain time interval (nine days were selected in our experiment). High value of RSI indicates a strong market and low value indicates weak markets. • MACD, a trendfollowing momentum indicator, is the difference between two moving average of price. In our experiment, 12-day EMA and 26-day EMA were used. • MACD signal line smoothes MACD. was selected for the calculation of MACD signal li9-day EMA of MACD ne. • Stochastic is an oscillator that tracks the relationship of each closing price to the recent high-low range. It has two lines: %K and %D. • %K is the “raw” Stochastic. In our experiment, the Stochastic’s time window was set to five for calculation of %K • %D smoothes %K – over a 3-day period in our experiment.
Outputs and Hidden layers • Output layer has the exponential moving average of day t(present) as output. Value of EMA at time t Value of EMA at time t-1 Value of data at time t • No. of hidden nodes = (M + N) / 2 • where M is the number of inputs and N is the number of outputs • So No. of hidden nodes is 5 in our case with M=10 and N=1
Final Network EMAs Weight Initialization using multiple linear regression MACD Stock data Random Weights EMA(t) RSI MACD Signal Lines Stochastics Input- 9 Nodes Output-1 node Hidden-5 Nodes
Results Estimated Moving Average( Predicted vs Real)
Questions! • How is NN prediction compared to Statistical Methods • Is the time series computation dependent on market conditions • Can direct stock prizes be fed into the Neural Network for learning • Can outputs be in terms of prizes • Is the computation justified for Regression learning weight initialization