Download
1 / 30
310 likes | 880 Views
Analysis of typhoon's data. Typhoon No.17 in 2012. The Track of Typhoon 17 , 2012. This is a track of Typhoon 17 . The period is from September to October 2012. The Japan Meteorological Agency. The Track of Typhoon 17 in 2012. Toyohashi City.

E N D
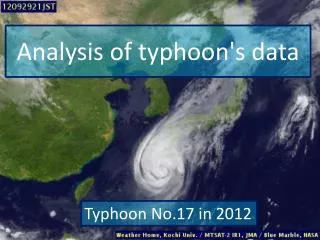
Analysis of typhoon's data Typhoon No.17in 2012
The Track of Typhoon 17 , 2012 This is a track of Typhoon 17. The period is from September to October2012. The Japan Meteorological Agency
The Track of Typhoon 17 in 2012 Toyohashi City This typhoon struck near Toyohashi City. http://agora.ex.nii.ac.jp/~kitamoto/
The first analysis of the typhoon's data is to research the difference between the wind speed of the right side of the typhoon and ones from the left side.
The Track of Typhoon 17 , 2012 This red arrow shows the track of Typhoon 17. Nagoya T Shizuoka Omaezaki Toyohashi Yahoo
The Track of Typhoon 17 , 2012 Nagoya T Shizuoka Toyohashi City is situated in Shizuoka Prefecture. Omaezaki Toyohashi Yahoo
The Track of Typhoon 17 , 2012 Shizuoka City and Omaezaki City are situated on the east side or the right side of Toyohashi City. OmaezakiCity is nearer to Toyohashi City than Shizuoka City. Nagoya T Shizuoka Omaezaki Toyohashi Yahoo
The Track of Typhoon 17 , 2012 Nagoya T Shizuoka Nagoya City is situated on the west side or left side of Toyohashi City. Omaezaki Toyohashi Yahoo
The Track of Typhoon 17 , 2012 Why? The viewpoint is that the wind speed of the east side of typhoon's course is stronger than ones of the west side of typhoon's course. Nagoya T Shizuoka Omaezaki Toyohashi Yahoo
The Track of Typhoon 17 , 2012 The red arrows are the winds that pressured the typhoon to go north. Nagoya T Shizuoka Omaezaki Toyohashi Yahoo
The Track of Typhoon 17 , 2012 The purple arrows are the winds of the typhoon itself. Nagoya T Shizuoka Omaezaki Toyohashi Yahoo
The Track of Typhoon 17 , 2012 Weak! Nagoya T Shizuoka Strong! If we think of the resultant forces of the two types of wind, we come to realize that the wind on the east side of the typhoon is stronger than those on the west side of the typhoon. Omaezaki Toyohashi Yahoo
A Comparison of the Average Wind Speed between Nagoya and Shizuoka This is a box plot of the average wind speed. The box plot of the left side represents those from Nagoya, and the box plot on the right side represents those from Shizuoka. I used the data of the wind speed when each station pressure was less than 1000 hPa.
A Comparison of the Average Wind Speed between Nagoya and Shizuoka If we look at these box plots, we can confirm that the wind speed in Shizuoka City is stronger than that in Nagoya City.
A Comparison of the Maximum Instantaneous Wind Speed between Nagoya and Shizuoka If we analyze the maximum instantaneous wind speed, we will find the same results concerning the average wind speed.
The second analysis of the typhoon's data is to research the relationship between station pressure and average wind speed.
This scatter diagram expresses the relationship between station pressure and average wind speed in Shizuoka. If we look at this scatter diagram, we come to conclude that there is a negative correlation. According to the t-test of the correlation coefficient, we can confirm that there is a strong negative correlation. The value of the correlation coefficient is approximately -0.72. If the station pressure is low, the average wind speed is strong.
This scatter diagram expresses the relationship between station pressure and average wind speed in Shizuoka. The equation of the regression line is y=-0.54 x +540. Because the correlation is strong, we can predict the average wind speed by the value of station pressure.
This scatter diagram expresses the relationship between station pressure and average wind speed in Nagoya. There is a strong negative correlation too. The value of the correlation coefficient is about -0.89. The equation of the regression line is y=-0.42 x +426. As in the case of Shizuoka, because the correlation is strong, we can predict the average wind speed by the value of the station pressure.
This scatter diagram expresses the relationship between station pressure and average wind speed in Omaezaki. There is a strong negative correlation too. The value of the correlation coefficient is approximately -0.88. The equation of the regression line is y=-0.75 x +761. As in the case of Shizuoka or Nagoya, because the correlation is strong, we can predict the average wind speed by the value of the station pressure.
This scatter diagram expresses the relationship between station pressure and average wind speed in Naha. If we look at this scatter diagram, we find that the shape of it is different from those of other scatter diagrams.
This scatter diagram expresses the relationship between station pressure and average wind speed in Naha before the center of the typhoon approached.
This scatter diagram expresses the relationship between station pressure and average wind speed in Naha after the center of the typhoon had passed.
This scatter diagram expresses the relationship between station pressure and average wind speed in Naha. This shape means that the wind speed near the typhoon's center is weak.
The third analysis of the typhoon’s data is to research a relationship between average wind speed and maximum instantaneous wind speed.
This scatter diagram expresses the relationship between average wind speed and maximum instantaneous wind speed in Shizuoka. There is a strong positive correlation. The value of the correlation coefficient is approximately 0.87. The equation of the regression line is y=1.95 x +1.96. Because the correlation is strong, we can predict the maximum instantaneous wind speed using the average wind speed.
This scatter diagram expresses the relationship between average wind speed and maximum instantaneous wind speed in Nagoya. There is a strong positive correlation too. The value of the correlation coefficient is approximately 0.98. The equation of the regression line is y=1.63 x +0.68.
This scatter diagram expresses the relationship between average wind speed and maximum instantaneous wind speed in Omaezaki. There is a strong positive correlation too. The value of the correlation coefficient is approximately 0.97. The equation of the regression line is y=1.49 x +1.55.
This scatter diagram expresses the relationship between average wind speed and maximum instantaneous wind speed in Naha. There is a strong positive correlation too. The value of the correlation coefficient is approximately 0.99. The equation of the regression line is y=1.60 x -0.43.
From the first analysis, the wind speed on right side of the typhoon is stronger than that of the left side of the typhoon. From the second analysis, if the station pressure is low, the wind speed is strong. If we use a regression line, there will be a possibility to be able to predict wind speed by the station pressure. From the third analysis, the maximum instantaneous wind speed of the typhoon is approximately 1.5 times the average wind speed.