Download
1 / 17
170 likes | 267 Views
Economics 12 Ch.9. Ms. Park. Next presenters. Linda, Tommy. Q&A. What do you think is the difference between GDP and GDP per capita?. GDP. Any guesses for top 10 countries?. GDP. 1. United States $16,244,600 million 2. China 8,227,200 million

E N D
Economics 12Ch.9 Ms. Park
Next presenters • Linda, Tommy
Q&A • What do you think is the difference between GDP and GDP per capita?
GDP • Any guesses for top 10 countries?
GDP 1. United States $16,244,600 million 2. China 8,227,200 million 3. Japan 5,959,782 million 4. Germany 3,428,131 million 5. France 2,612,878 million 6. United Kingdom 2,471,784 million 7. Brazil 2,252,664 million 8. Russian Federation 2,014,775 million 9. Italy 2,014,670 million 10. India 1,841,710 million 11. Canada 1,821,424 million
GDP per capita • Luxembourg $116,000 • Qatar 98,000 • Norway 97,000 • Switzerland 83,000 • Australia 66,000 • UAE 64,000 • Denmark 60,000 • Sweden 58,000 • Canada 51,000 • Netherlands 50,000 • United States 49,000 China 6,000
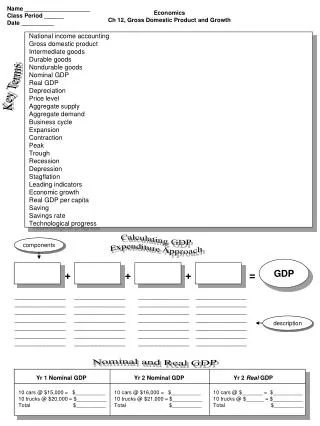
Per Capita GDP • Per capita GDP = GDP / population • Real GDP: GDP expressed in constant dollars from a base year • Per capital real GDP = ??? • Nominal GDP: GDP expressed in current dollar value
Adjustments to per capita GDP • Depending on how GDP is used, either of two adjustments can be made: • Inflation adjustment: done by using __________________. • Exchange-rate adjustment: done by expressing all countries’ GDP in one currency, usually in USD.
Limitations of GDP 1. Excluded activities: GDP does not include some types of productive activities. This can understate economic activity and living standards. • Non-market activities: homework, unpaid childcare • Underground activities: smuggling, under-the-table money 2. Product Quality: GDP does not capture the quality of improvements in products
Limitations of GDP Cont. 3. Composition of output: GDP does not tell us what is produced and purchased 4. Income Distribution: GDP does not reflect how output is distributed among citizens 5. Leisure: With increased leisure, GDP understates economic well-being 6. Environment: GDP does not differentiate between activities that are harmful to the environment and those that are not
Other Economic Measures • Gross National Product (GNP): total income acquired by Canadians both within Canada and elsewhere • GNP= GDP + Net investment income
Q&A • Traditionally, Canada’s GNP has been less than GDP. Why do you think it is so?
Other Economic Measures Cont. • Net Domestic Income (NDI): income earned by households supplying resources in Canada • NDI = GDP – amounts that are not earning from current production (indirect taxes, depreciation, allowances, statistical discrepancy, etc…)
Other Economic Measures Cont. • Personal Income (PI): the income actually received by households • PI = GDP + Government transfer payments + Other payments to persons – earnings not paid out to persons – net investment income
Other Economic Measures Cont. • Disposable Income (DI) = Household incomes – Personal taxes and other personal transfers to the government
Due Today • Assignment from last class: Textbook Question #1 & Handout Problem #1 • Assignment for today: Textbook Question #2 & 6