Download
1 / 61
610 likes | 728 Views
Profile and Survey of Laboratory Proficiency Water and Wastewater Treatment Systems Division of Technical Assistance and Outreach Bureau of Water Supply and Wastewater Management October 2003. Introduction

E N D
Profile and Survey of Laboratory Proficiency Water and Wastewater Treatment Systems Division of Technical Assistance and Outreach Bureau of Water Supply and Wastewater Management October 2003
Introduction The purpose of this water and wastewater profile and survey is to better understand the laboratory proficiency problems confronting these industries. This effort helps to better define the needs for a state program for laboratory accreditation. This profile and survey is not intended to meet the statistical standards of research. However, the Department believes it represents an informed view for the evaluation of different regulatory alternatives. Methodology - Survey The regulated community impacted by the proposed laboratory accreditation program is very diverse. It involves a variety of ownership, resources, size, location and permit requirements. These factors limit the validity of reaching broad based conclusions about these industries. To limit biased results, survey a significant number of systems, and provide some reasonable assurances of accuracy, the Department collected information from individuals serving on the Environmental Training Partnership (ETP). The ETP is made up of 100+ individuals that have provided technical assistance to water and wastewater systems over the past 10 years. Each individual holds an appropriate state certification for system operation and has demonstrated their proficiency in their area of expertise. These individuals are not full-time employees of the Department of Environmental Protection and have permanent employment at a water or wastewater system. Their role with the ETP involves one-on-one assistance to water and wastewater systems. Over 350 water and wastewater systems have participated in this program over the past 10 years. The ETP staff offered a special opportunity to garner their opinions and observations about the role lab proficiency plays in the successful operation of a system. By using ETP input, this profile assures a significant sample, statewide analysis, expert hands-on experiences while limiting a bias view of the regulator or regulated community. It must be noted that ETP services are provided only upon request. These services usually involve small non-profit treatment systems that have technical problems or are involved in a startup of new treatment technology. This may bias some of the results of this survey. Two types of survey forms were developed by the Division of Technical Assistance and the Lab Accreditation and Quality Assurance Section. These forms with instructions were mailed to all ETP employees who provide technical assistance.
Methodology - Profile A wastewater system profile form was also developed by the Division of Technical Assistance and the Lab Accreditation and Quality Assurance Section. This form’s purpose is to collect information used to create a profile of the wastewater industry’s laboratory needs and capabilities. Water Management regional staff working with wastewater facilities provided this information. Each regional office participated in collection of the profile data to insure inclusion of a suitable range of systems throughout the state. Two-hundred five (205) systems were targeted for profiling. An effort was made to statistically represent the different sizes and types of wastewater systems in the state. Question Design Questions were designed to provide both information and informed opinion. Opinion was qualified or quantified through the use of numerical scales of 1 – 10, percentage of occurrence, and scales with varying degrees of reliability, significance of impact, acceptability. To the extent possible, a neutral choice was not provided for each question. Information questions were specific and included both narrative and numerical values. All participants in the surveys and profiling exercise were provided the same set of questions using standardized documents. Response of Surveyors and Profilers Profilers surveyed 162 wastewater systems or 80% of the target profile sample. This sample makes up approximately 4% of the 4000 wastewater treatment systems in the state. For the purpose of this exercise, no single family residential treatment systems were included. ETP staff completed survey information on approximately 135+ drinking water systems. This sample makes up approximately 6%+ of the 2200 community water systems in the state. For the purpose of this exercise, no nontransient noncommunity water systems were included. A plus value is provided with this number, because some respondents failed to indicate the number of systems in which they provided services.
34+ systems 29% 35+ systems 30% DNR 45 systems 39% DNR 2 systems 2% 25 2 20 10 12 2 25 DNR 20 8 8 4 5 0% 20% 40% 60% 80% 100% ETP staff completed survey information on approximately 252 waste water systems. This sample makes up approximately 5% of the 4,000 wastewater systems in the state. Collection and Tabulation of Data The information provided by the survey and profile forms were tabulated and presented either in a bar graph or a pie chart format. An explanation of how the bar graph data is presented is below.: Percentage of the total number of systems where this answer or opinion is assigned 34+ systems 29% Means did not report (DNR) number of systems assistance provided DNR Total number of assistance providers in agreement with percentage value answer DNR Means the number of systems technical assistance provided 2 12 20 5 Graph within a Graph Percentage Value Allows comparison of water and wastewater data.
Drinking Water Systems Questions, Data and Observations 0% 20% 40% 60% 80% 100% 1.When providing technical assistance to a drinking water facility, you evaluate their laboratory proficiency approximately… percent of the time Observation: ETP staff generally evaluate lab proficiency for water systems when providing technical assistance. 34+ systems 29% 35+ systems 30% DNR 45 systems 39% DNR 2 systems 2% 25 2 20 10 12 2 25 DNR 20 8 8 4 5
26 systems 20% 30+ systems 22% 33+ systems 25% 42 systems 31% 0% 20% 40% 60% 80% 100% 2 systems 2% 20 DNR DNR 12 2 25 25 10 2 4 5 8 20 2. What percent of your drinking water systems have problems with laboratory proficiency? Observation: A lack of lab proficiency creates a varying degree of problems for water systems served.
No Sight Moderate Significant Serious Impact Impact Impact Impact Impact • How would you classify the impact of lab proficiency on poorly performing treatment plant processes? Observation: ETP staff views poor lab proficiency as having a moderate or significant impact on treatment plant processes. 46 systems 37 % 20 66 systems 50% 8 4 2 DNR 4 2 20 systems 13% 25 DNR 25 12 20 10 DNR
0% 20% 40% 60% 80% 100% Poor Marginal Acceptable Good Excellent 4. What approximate percentage of the drinking water systems you work with, treating less than 1 mgd., conduct their analysis at the treatment site? What is their proficiency? DNR 109+ systems 82% 10 Observation: Most small water systems conduct analysis at their treatment system. 22+ systems 16% 25 25 4 12 2 systems 1% 5 2 20 DNR 2 20 8 82+ systems 67% Observation: Most small water systems have an acceptable laboratory proficiency level with some marginal activities. 2 DNR 10 6 systems 4% 25+ systems 19% 25 12 systems 8% 5 DNR 20 2 12 25 20 4
0% 20% 40% 60% 80% 100% Poor Marginal Acceptable Good Excellent 5. What approximate percentage of the drinking water systems you work with, treating greater than 1 mgd., conduct their analysis at the treatment site? And what is their proficiency? Observation: Most large water systems conduct analysis at their treatment system with a sizable number using off-site analysis services. 61+ systems 68% 25 DNR 8 systems 9% 20 systems 22% 12 4 8 20 20 Observation: Most large water systems have an acceptable laboratory proficiency level . 40+ systems 49% 29 systems 36% 12 systems 15% DNR 20 25 12 20 4
2 DNR 20 20 5 4 12 DNR DNR 8 10 25 12 Worse Marginally better Equal to Better Significantly than on-site than on-site on-site labs than on-site better than labs labs labs on-site labs 6. In your opinion, how would you rate the lab analysis provided by off-site dedicated laboratories verses on-site drinking water facility laboratories? 88+ systems 75% Observation: Off-site laboratories are rated as better than on-site labs 8 systems 7% 10 systems 8% 12 systems 10%
48+ systems 36% 40 systems 30% 25 DNR 12 25 systems 19% 20 systems 15% 10 4 0% 20% 40% 60% 80% 100% 2 5 8 DNR 25 20 20 2 • What percentage of on-site drinking water laboratories are properly equipped to do analysis of samples? Observation: Many water systems have or nearly have properly equipped laboratories to conduct analysis.
0% 20% 40% 60% 80% 100% Poor Marginal Acceptable Good Excellent • What percentage of the drinking water systems you work with have their certified operators conducting the majority of laboratory analyses? And how would you rate their performance? 51+ systems 37% Observation: A significant number of water systems use certified operators to perform laboratory analysis. . 24+ systems 18% 53 systems 39% 4 12 2 20 5 systems 6% DNR DNR 8 10 20 25 5 25 2 82 systems 65% Observation: The performance of certified operators in conduction laboratory analysis is generally acceptable; however a significant number of operators are marginal in this skill. DNR 20 20 5 2 6 systems 6% 37 systems 29% DNR 12 10 2 25 25 4
9. Uses appropriate sampling techniques and proper sample preservation? 20 No No Yes Yes 5 25 1 2 3 4 5 6 7 8 9 10 1 2 3 4 5 6 7 8 9 10 7 9 20 7 7 8 12 8 10 12 2 DNR DNR 25 8 20 DNR 20 25 4 25 2 2 On a scale of 1 to 10, how would you categorize the problems of on-site drinking water laboratory personnel? 67 systems 48% Observation: Most operators are knowledgeable in sampling technique and preservation. 24 systems 18% 2 systems 1% 25 systems 18% 2 systems 1% 20 systems 14% 10. Have a basic understanding of skills, knowledge and abilities to conduct analysis? 76 systems 53% Observation: Certified operators generally understand the skills, knowledge and abilities to conduct an analysis 32 systems 23% 25 systems 18% 8 systems 6% 2 systems 1%
No No Yes Yes 1 2 3 4 5 6 7 8 9 10 1 2 3 4 5 6 7 8 9 10 11. Maintain equipment and provide sufficient QA/QC? Observation: QA/QC is mediocre at best. 16 systems 12% 45 systems 34% 12 systems 9% 5+ systems 4% 28 systems 21% 25 systems 18% 2 systems 2% 12 25 8 10 DNR DNR 25 20 20 6 5 2 12. Use sample analyses appropriately and timely to make process control decisions 40 systems 29% Observation: The use of sample analyses in process control decisions is average. 49 systems 36% 4+ systems 3% 20 20 8 12 systems 9% 5 systems 4% 25 systems 18% 2 systems 1% DNR 4 2 12 4 25 25 10 5 2
No Yes 1 2 3 4 5 6 7 8 9 10 25 2 4 8 5 25 12 DNR 10 20 20 2 13. Maintain appropriate and correct records of analysis? Observation: Record keeping is generally acceptable 54 systems 40% 30 systems 26% 2 systems 1% 25 systems 18% 12 systems 8% 10 systems 7%
Alkalinity Fecal Coliform Reliable Very Reliable 38% Somewhat 14% Reliable 29% Good Good Reliability Reliability 14% 31% Somewhat Very Reliable Reliable Reliable 23% 43% 8% ANALYSIS OF SAMPLING Based upon your experiences with the ETP, rate the reliability of chemical and biological analyses conducted by on-site drinking water laboratories. Test Type Observation: almost ¼ of respondents indicate alkalinity testing is borderline Observation: almost 30% of respondents indicate fecal coliform testing is somewhat reliable
Very Somewhat Reliable Reliable Good Reliability 7% 14% 37% Reliable 21% Good Reliability 58% Nitrate Flow Not Reliable 25% Somewhat Reliable 13% Reliable 25% Observation: Over 1/3 of nitrate testing is questionable Observation: Flow testing is generally acceptable and usually reliable
Very Not Reliable Reliable 8% 8% Somewhat Reliable 15% Very Reliable Good Reliability 42% Reliable 46% 23% Residual Disinfection Concentration pH Reliable 25% Good Reliability 33% Observation: pH testing is generally reliable however 23% fall below the reliable level Observation: There is no problem with the residual disinfection concentration analysis
Turbidity Copper Very Reliable 17% Very Reliable 17% Reliable 33% Not Reliable 33% Good Reliability 17% Good Reliable 50% Reliable 33% Observation: There is no problem with the reliability of turbidity results Observation: Even though a limited number of systems conduct Copper analysis, many who do have problems
Reliable 18% Very Reliable 46% Good Reliability 36% Chlorine SOCs, VOCs, Chlorine Dioxide, Lead, Aluminum, Iron, Manganese, Sulfate, TDS & TTHMS Not usually conducted at on-site labs or insufficient data to make and observation Observation: There is no problem with the reliability of Chlorine test results
34+ systems 29% 35+ systems 30% DNR 0% 20% 40% 60% 80% 100% 45 systems 39% DNR 2 systems 2% 25 2 20 10 12 2 25 DNR 20 8 8 4 5 0% 20% 40% 60% 80% 100% Wastewater Systems Questions, Data and Observations 1.When providing technical assistance to a wastewater facility, you evaluate their laboratory proficiency approximately…percent of the time Observations: 1. Wastewater ETP staff are twice as likely to evaluate lab proficiency than Drinking Water ETP staff. 2. Wastewater ETP staff usually conduct an evaluation of lab proficiency on most technical assistance sites. 113 systems 67% Drinking Water Data 20 10 17 15 systems 10% 32 systems 21% 30 2 systems 1% 28 DNR 30 24 DNR 10 10 4 2 5 2 DNR
20 DNR DNR 12 2 25 25 10 2 4 5 8 20 0% 20% 40% 60% 80% 100% 0% 20% 40% 60% 100% 80% 2. What percent of your wastewater systems have problems with laboratory proficiency? 26 systems 20% 33+ systems 25% Observations: 1. Almost 90% of wastewater systems in the program have a percentage rating of 60% or greater for experiencing laboratory proficiency problems. Almost 65% of these systems rate above the 80% level. 2. Wastewater systems have nearly twice the problems with laboratory proficiency as drinking water systems. 30+ systems 22% 42 systems 31% 2 systems 2% Drinking Water Data 110 systems 47% 90 systems 39% 10 20 10 17 2 10 30 2 systems 1% 5 24 30 systems 13% 2 28 4 DNR DNR 10 30 30
46 systems 37 % 20 8 66 systems 50% 4 2 DNR 4 2 25 DNR 20 systems 13% 25 12 20 10 DNR No Sight Moderate Significant Serious Impact Impact Impact Impact Impact Drinking Water Data No Sight Moderate Significant Serious Impact Impact Impact Impact Impact • How would you classify the impact of lab proficiency on poorly performing treatment plant processes? 183 systems 73% 30 10 5 10 Observations: 1. Wastewater ETP technical assistance providers overwhelming agree that poor lab proficiency significantly impact treatment plant processes. 2. Drinking Water ETP providers generally view the importance of laboratory proficiency as significant, but not to the extent of Wastewater ETP providers 2 10 30 5 24 37 systems 15% 2 32 systems 12% 25 20 DNR 28 10 17 DNR 4 20 DNR
DNR 10 109+ systems 82% 17 25 25 22+ systems 16% 12 4 2 5 2 systems 1% DNR 20 8 20 2 0% 20% 40% 60% 80% 100% 4. What approximate percentage of the wastewater systems you work with, treating less than 1 mgd., conduct their analyses at the treatment site? What is their proficiency? Observations: 1. Small wastewater and drinking water systems appear to rely equally on in-house and off-site lab analysis 0% 20% 40% 60% 80% 100% Drinking Water Data 123 systems 51% 4 45 systems 18% 28+ systems 11% 24systems 19% 24 30 25 systems 10% 5 28 2 10 10 DNR 5 10 20 30 DNR 17 20 5
Poor Marginal Acceptable Good Excellent Poor Marginal Acceptable Good Excellent 4 a. What is their proficiency? Observations 1. 44% of all small wastewater systems are considered only to be marginally proficient in lab analysis. 2. Small water systems demonstrate a slightly better laboratory proficiency than wastewater (27% verses 44%), This does not account for the number of systems in the DNR listed as marginal 82+ systems 67% 2 DNR 10 25+ systems 19% 6 systems 4% 25 12 systems 8% 5 DNR 20 2 12 25 20 4 Drinking Water Data 109 systems 45% 106 systems 44% 4 2 20 28 24 5 10 30 17 DNR 26 systems 11% 10 DNR 5 10 25 20 30
61+ systems 68% 25 DNR 12 8 systems 9% 20 systems 22% 4 8 20 20 0% 20% 40% 60% 80% 100% 0% 20% 40% 60% 80% 100% 5. What approximate percentage of the wastewater systems you work with, treating greater than 1 mgd., conduct their analyses at the treatment site? And what is their proficiency? Observations: 1.A significant percentage of large wastewater systems conduct laboratory analyses at their treatment site. 2. It appears some large drinking water systems do not conduct on-site laboratory analyses. This is not necessarily true for large wastewater systems. 128 systems 51% 20 Drinking Water Data 30 87 systems 35% 10 DNR 17 32 systems 13% DNR 2 5 10 10 28 30 2 25 24 20 10 4
40+ systems 49% 29 systems 36% DNR 12 systems 15% 20 25 12 20 4 Poor Marginal Acceptable Good Excellent Poor Marginal Acceptable Good Excellent 5.a And what is their proficiency? 167 systems 64% 25 Drinking Water Data 2 Observations: 1. Wastewater ETP providers find large system laboratories generally proficient in lab analyses. 2. There appears to be a difference between large wastewater and large drinking water lab proficiency. 28 10 30 59 systems 23% 10 36 systems 13% 17 24 10 20 DNR 5 10 5 DNR 4 10 DNR 2 20 30
2 DNR 20 20 5 4 8 systems 7% 10 systems 8% 12 12 systems 10% DNR DNR 8 10 25 12 6. In your opinion, how would you rate the lab analyses provided by off site dedicated laboratories verses on-site wastewater facility laboratories? 88+ systems 75% Observations: 1. Wastewater ETP providers find system laboratories as equal to offsite laboratories. 2. There appears to be no significant differences between wastewater and drinking water views of on-site laboratory proficiency verses offsite laboratory proficiency. Worse Marginally Equal to Better Significantly than on-site better than on-site labs than on-site better than on-site labs on-site labs labs on-site labs Drinking Water Data 93 systems 40% 93 systems 40% 10 DNR DNR 10 5 10 30 19 systems 8% 5 24 28 4 25 systems 11% 2 systems 1% 17 DNR 10 25 2 30 20 2 Worse Marginally Equal to Better Significantly han on-site better than on-site labs than on-site labs better than labs on-site labs on-site labs
0% 20% 40% 60% 80% 100% 0% 20% 40% 60% 80% 100% • What percentage of on-site wastewater laboratories are properly equipped to do analyses of samples? Observations: 1. Wastewater laboratories appear to be properly equipped to do sample analysis. 2. on-site wastewater laboratories appear to be better equipped to do sample analyses than on-site drinking water laboratories. 48+ systems 36% 25 DNR 40 systems 30% 12 188 systems 75% 10 4 2 5 25 systems 19% 20 systems 15% 8 DNR 30 25 20 20 2 25 4 Drinking Water Data 24 42systems 17% 28 30 20 17 12 systems 4% 2 DNR 5 DNR 10 systems 4% 2 10 10 10 10 5 20
0% 20% 40% 60% 80% 100% 0% 20% 40% 60% 80% 100% • What percentage of the wastewater systems you work with have their certified operators conducting the majority of laboratory analyses? And how would you rate their performance? 51+ systems 37% 24+ systems 18% 4 53 systems 39% 12 2 20 DNR DNR 5 systems 6% 8 10 20 129 systems 53% 25 5 25 2 20 Drinking Water Data DNR Observation: 1. A significant number of wastewater systems use certified operators to perform laboratory analyses. 2. It appears more wastewater systems use certified operators to conduct laboratory analyses than do drinking water systems. DNR 76 systems 31% 5 17 5 10 27 systems 11% 28 2 4 10 10 systems 5% 2 20 30 10 25 30 24
Poor Marginal Acceptable Good Excellent Poor Marginal Acceptable Good Excellent • And how would you rate their performance? Observations: 1. The performance of certified operators in conducting wastewater laboratory analyses may be a problem; 36 % of the systems evaluated have marginal performance. 2. Drinking water systems have nearly the same acceptable/good rate of 71% compared to 64% for wastewater. 3. Neither drinking water or wastewater certified operators show laboratory analyses as a strong point. Actually, it appears there s a problem in the industry at many sites. 82 systems 65% DNR 20 20 5 37 systems 29% 2 6 systems 6% DNR 12 10 2 25 25 4 Drinking Water Data 56 systems 23% 86 systems 36% 4 100 systems 41% 20 2 24 5 30 10 30 25 2 5 28 10 DNR 17 20 10 DNR
9. Uses appropriate sampling techniques and proper sample preservation? No Yes No Yes 25 1 2 3 4 5 6 7 8 9 10 1 2 3 4 5 6 7 8 9 10 7 7 8 8 12 2 DNR 20 20 4 25 2 On a scale of 1 to 10, how would you categorize the problems of on-site wastewater laboratory personnel? Observation: 1. There appears to be a problem with appropriate sampling technique and sample preservation at wastewater systems. 46% are below the 7 level. 2. Water systems apparently do an acceptable job of sampling technique and preservation. 86% are at or above the 7 level. 3. Water systems appear to be better at sampling than wastewater systems. 67 systems 48% 24 systems 18% 2 systems 1% 20 systems 14% 2 systems 1% 25 systems 18% Drinking Water Data 46 systems 18% 41 systems 17% 88 systems 36% 15 systems 6% 20 10 DNR 25 systems 10% 25 systems 10% 2 17 30 10 systems 3% 24 10 5 10 28 DNR 10 DNR 4 20 5 30 25
76 systems 53% 20 32 systems 23% 5 9 8 systems 6% 20 7 2 systems 1% 25 systems 18% 12 10 DNR 25 8 DNR 25 2 No Yes 1 2 3 4 5 6 7 8 9 10 No Yes 1 2 3 4 5 6 7 8 9 10 10. Have a basic understanding of skills, knowledge and abilities to conduct analyses? Observation: 1. Wastewater systems appear to fall into two distinct categories: those having KSA’s (75%) and those who fall below the level 7. 2. Water systems, in comparison to wastewater systems, have less understanding in general of KSA’s but a higher capability across all systems in the sample results. Drinking Water Data 90 systems 39% DNR 63 systems 27% 20 38 systems 16% 25 30 20 systems 9% 17 systems 8% 4 5 28 2 systems 1% 10 24 30 5 17 2 10 10 10 DNR DNR
16 systems 12% 45 systems 34% 12 systems 9% 5+ systems 4% 28 systems 21% 25 systems 18% 2 systems 2% 12 25 8 10 DNR DNR 25 20 20 6 5 2 No Yes No Yes 1 2 3 4 5 6 7 8 9 10 1 2 3 4 5 6 7 8 9 10 11. Maintain equipment and provide sufficient QA/QC? Observation: 1. Wastewater systems have a problem with QA/QC. Nearly 70% have a less than level6 rating. 2. Drinking water systems appear to have similar problems with QA/QC as compared to wastewater with an even higher less than 6 level rating of 82%. 65 systems 26% 24 systems 10% 54 systems 23% 10 30 systems 11% 2 5 5 systems 1% 17 systems 7% 28 systems 11% 2 24 10 25 systems 10% 20 10 30 DNR DNR DNR 20 10 28 5 30 25 17
20 20 8 DNR 4 2 12 4 25 25 10 5 2 No Yes 1 2 3 4 5 6 7 8 9 10 1 2 3 4 5 6 7 8 9 10 12. Use laboratory analyses appropriately and timely to make process control decisions? Observations: 1. Wastewater systems have an average ability to use analyses to make process control decisions…some facilities stand out as very capable, but a significant number are marginal at best. 2. Drinking Water systems have a 70 % above level 6 level for process control making decisions as compared to wastewater system’s 80% . There is most likely no statistical difference. 40 systems 29% 49 systems 36% 4+ systems 3% 12 systems 9% 5 systems 4% 25 systems 18% 2 systems 1% No Yes 87 systems 36% 30 systems 11% 72 systems 30% 20 10 systems 4% DNR 30 25 20 systems 9% 4 20 systems 9% 4 30 5 systems 1% 24 10 10 28 17 5 2 10 DNR 20 5 DNR
54 systems 40% 30 systems 26% 25 12 systems 8% 10 systems 7% 2 4 2 systems 1% 25 systems 18% 8 5 25 12 DNR 10 20 20 2 Yes No 1 2 3 4 5 6 7 8 9 10 No Yes 1 2 3 4 5 6 7 8 9 10 13. Maintain appropriate and correct records of analyses? Observations: 1. Approximately 74% of wastewater systems maintain reasonable records of analyses. 2. There appears to be no significant difference between drinking water and wastewater systems relative to record keeping. 17 28 systems 11% 35 systems 14% 100 systems 40% 50 systems 20% 15 systems 6% 10 17 20 systems 8% 2 systems 1% 5 10 DNR 30 24 10 5 30 28 2 20 4 DNR 10 DNR 20 25
ANALYSIS OF SAMPLING Based upon your experiences with the ETP, rate the reliability of chemical and biological analyses conducted by on-site wastewater laboratories. Ammonia - N Alkalinity Reliable Reliable 29% 37% Good Good Reliable 25% Reliability 41% Somewhat Reliable Somewhat 24% Very Reliable Reliable 6% Not Reliable 19% 13% Reliable Not 6%
Good Reliability 33% Not Reliable Not Somewhat 6% Reliable Reliable Somewhat 11% Good Reliable 22% Reliability 11% 44% Reliable Reliable 45% 28% BOD-CBOD Color
Dissolved Oxygen Not Somewhat Reliable Somewhat Reliable Very Reliable 7% Reliable 14% 7% 29% Good Reliability Reliable 43% 14% Reliable 43% Good Reliability 43% Conductivity
Fecal Coliform Flow Very Very Somewhat Not Reliable Reliable Reliable Reliable 17% 7% 28% 13% Good Reliability Reliable Somewhat 33% 17% Reliable 27% Good Reliable Reliability 20% 38%
Nitrate Foam Not Very Reliable Reliable 13% 13% Good Somewhat Reliability Reliable Good Somewhat 40% 40% Reliability Reliable 25% 24% Reliable Reliable 20% 25%
Odor Ortho-phosphate Very Good Not Somewhat Reliable Reliability Reliable Reliable 13% 17% 13% 25% Good Reliability 13% Somewhat Reliable Reliable Reliable 37% 24% 58%
Oxidation Reduction Potential pH Good Reliability Somewhat Very 13% Reliable Somewhat Reliable Reliable 28% 38% 38% Reliable Reliable Good 17% 49% Reliability 17%
Somewhat Not Reliable Reliable Very Somewhat Reliable Reliable 35% Reliable 29% Reliable 74% Residual Disinfection Concentration Sheen 13% 12% 13% Good Reliability 24%
Sludge Volume Index Solids (TSS,TDS,TS, VSS) Somewhat Very Somewhat Very Reliable Reliable Reliable Reliable 20% 20% 19% 25% Reliable 25% Good Reliable Reliability Good 27% Reliability 31% 33%
Good Not Somewhat Reliability Reliable Very Reliable Reliable 11% 7% 20% Somewhat Reliable Reliable Good 46% Reliability Reliable 27% 56% Solids (settable) Sulfite 11% 22%
Somewhat Reliable 11% Very Reliable 11% Reliable Good 33% Reliability 45% Turbidly
Survey Findings Both the water and wastewater survey substantiated the need to improve laboratory proficiency. The ETP technical assistance providers for wastewater and water view this shortfall as a significant factor in dealing with treatment problems. The ETP participants in this survey found 51% of water systems and 80% of wastewater systems have problems with laboratory proficiency. The survey establishes the certified operator as the primary provider of chemical and biological analysis services. This fact bridges the operator certification program to the environmental laboratory accreditation program. With the new emphasis on process control decision-making, the survey clearly demonstrates this tandem relationship. Small water and wastewater systems are more likely than large water and wastewater systems to experience problems with laboratory proficiency. The water and wastewater laboratory proficiency of off-site labs verses on-site private labs is rated equal or better than most on-site labs. Both on-site water and wastewater laboratories have significant shortfalls with their QA/QC protocols and sampling procedures. The ETP survey indicated that water systems have moderate laboratory proficiency problems with Fecal Coliform (30%), alkalinity(20%) and nitrate (38%) analysis. The survey did not differentiate whether these problem were in small or large water systems. The ETP survey indicated that wastewater systems have moderate laboratory proficiency problems with Fecal Coliform (40%), Ammonia-N (32%), BOD-CBOD (28%), alkalinity(30%) and nitrate(40%). Based on this survey, the existing water laboratory certification program required by Chapter 109 provides a measurable improvement of laboratory proficiency over the non-regulated wastewater laboratories.
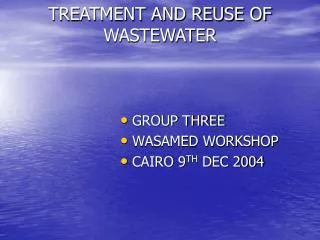
Profile of Randomly Selected Wastewater Systems Throughout the Commonwealth of Pennsylvania
Greater than 5 mgd. flows Less than 100,000 gal. flow 9% - 15 systems 49% - 83 systems > Than 1 mgd. to 5mgd. flows 15% - 26 systems 100,000 gal. to 1 mgd. flow 27% -46 systems Wastewater Systems Profile Distribution