Download
1 / 10
100 likes | 235 Views
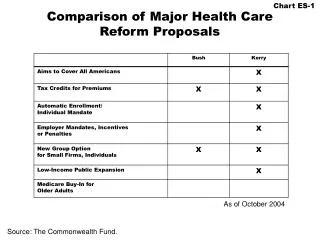
Chart ES-1. Comparison of Major Health Care Reform Proposals. As of October 2004. Source: The Commonwealth Fund. Chart ES-2. Comparison of Candidates’ Health Insurance Expansion Proposals: Coverage and Costs. As of October 2004.

E N D
Chart ES-1 Comparison of Major Health CareReform Proposals As of October 2004 Source: The Commonwealth Fund.
Chart ES-2 Comparison of Candidates’ Health Insurance Expansion Proposals: Coverage and Costs As of October 2004 * Based on 2004 Current Population Survey estimate of 45 million uninsured. ** The Lewin Group and the American Enterprise Institute estimate costs over 2006–2015, but only costs which would occur over 2005–2014 are shown here. See Appendix for full explanation. Source: The Commonwealth Fund, based on U.S. Department of the Treasury; Congressional Budget Office; Kenneth E. Thorpe, Emory University; the Lewin Group; and AEI.
Chart ES-3 Comparison of Coverage and Cost Estimatesfor President Bush’s Health Plan, 2005–2014* As of October 2004 * The Lewin Group and the AEI estimate costs over 2006–2015, but only costs which would occur over 2005–2014 are shown here. See Appendix for full explanation. Source: The Commonwealth Fund, based on U.S. Treasury; CBO; Kenneth E. Thorpe, Emory University; the Lewin Group; and AEI.
Chart ES-4 Comparison of Coverage and Cost Estimatesfor Senator Kerry’s Health Plan, 2005–2014* As of October 2004 * The Lewin Group and the AEI estimate costs over 2006–2015, but only costs which would occur over 2005–2014 are shown here. See Appendix for full explanation. Source: The Commonwealth Fund, based on Kenneth E. Thorpe, Emory University;the Lewin Group; and AEI.
Chart 1 Growth in the Number of Uninsured,1987–2003 Number of uninsured, in millions * 1999–2003 estimates reflect the results of follow-up verification questions and implementation of Census 2000-based population controls. Source: U.S. Census Bureau, March CPS Surveys 1988 to 2004.
Chart 2 National Health Expenditures’ Average Annual Percentage Growth, Selected Calendar Years, 1960–2004 Percent Projected Source: The Commonwealth Fund, based on K. Levit et al., “Health Care Spending Rebound Continues in 2002,” Health Affairs 23 (Jan./Feb. 2004): 147–59; and S. Heffler et al., “Health SpendingProjections Through 2013,” Health Affairs Web Exclusive (Feb. 11, 2004): W4-79–W4-93.
Chart 3 National Health Expenditures’Percent of Gross Domestic Product, Selected Countries and Years, 1980–2001 Percent Source: The Commonwealth Fund, based on Centers for Medicare & Medicaid Services, Office of the Actuary, National Health Expenditures Projections, 2002, Table 1; Organisation for Economic Cooperation and Development, OECD Health Data, Frequently Asked Data, 2003, Table 10.
Chart 4 One of Four People Under Age 65Was Uninsured During Part of 2002 Uninsured all year 13.1% [62 million] Uninsured part year 12.2% Insured all year 74.7% [182 million] Total Population Under Age 65 = 244 Million Source: Medical Expenditure Panel Survey Statistical Brief #45—The Uninsured in America, 1996–2003. Civilian Noninstitutionalized Population Under Age 65, July 2004.
Chart 5 Comparison of Major Health CareReform Proposals As of October 2004 Source: The Commonwealth Fund.
Chart 6 Comparison of Candidates’ Health Insurance Expansion Proposals: Coverage and Costs As of October 2004 * Based on 2004 Current Population Survey estimate of 45 million uninsured. ** The Lewin Group and the American Enterprise Institute estimate costs over 2006–2015, but only costs which would occur over 2005–2014 are shown here. See Appendix for full explanation. Source: The Commonwealth Fund, based on U.S. Department of the Treasury; Congressional Budget Office; Kenneth E. Thorpe, Emory University; the Lewin Group; and AEI.