Uncertainty & Errors in Measurement
Uncertainty & Errors in Measurement. Waterfall by M.C. Escher. Objectives. Difference between random errors (uncertainties) and systematic errors Difference between precision and accuracy Repeatable Reproducible Outliers. Calculations involving addition & subtraction.

Uncertainty & Errors in Measurement
E N D
Presentation Transcript
Objectives • Difference between random errors (uncertainties) and systematic errors • Difference between precision and accuracy • Repeatable • Reproducible • Outliers
Calculations involving addition & subtraction When adding and subtracting quantities, the absolute uncertainties are added. Example: (a) Mass of 1st zinc = 1.21g ± 0.01g Mass of 2nd zinc = 0.56g ± 0.01g Total mass of the 2 pieces of zinc = (b) Final burette reading = 38.46 cm3 ± 0.05 cm3 Initial burette reading = 12.15 cm3 ± 0.05 cm3 Volume titrated = WS
Calculations involving multiplication & division When multiplying or dividing quantities, then the percent (or fractional) uncertainties are added. Example: Molarity of NaOH(aq) = 0.20 M (± 0.05 M) Percentage uncertainty = Volume of NaOH(aq) = 25.00 cm3 (± 0.10 cm3) Percentage uncertainty = Therefore, the no. of moles of NaOH = May convert % uncertainty back to absolute uncertainty. copy
Example When the temperature of 0.125kg of water is increased by 7.20C. Find the heat required. Heat required = mass of water x specific heat capacity x temperature rise = 0.125 kg x 4.18 kJ kg-1 0C-1 x 7.20C = Since the temperature recorded only has 2 sig fig, the answer should be written as ____________ WS
Multiple math operations Example: copy
Quoting values with uncertainties The uncertainty is usually quoted to one significant figure. Your measurement should be stated so that the significant is in the last significant figure.
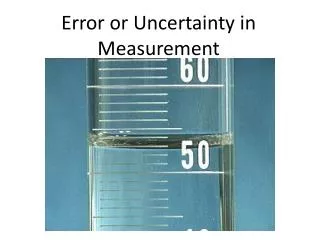
Errors (uncertainties) in raw data When a physical quantity is taken, the uncertainty should be stated These uncertainties may be estimated by • from the smallest division from a scale • from the last significant figure in a digital measurement • from data provided by the manufacturer .
Digital Instruments If the balance is accurate to +/- 0.001g, the measurement is 45.310g If the balance is accurate to +/- 0.01g, the measurement is 45.31g Uncertainty for digital instrument : +/- the smallest division
Analogue Instruments A burette of value 34.1cm3 becomes 34.10cm3 (±0.05cm3) Note: the volume is cited to 2 decimal places so as to be consistent with the uncertainty. Uncertainty for analogue instrument: half of the smallest division.
Higher levels of uncertainty is normally indicated by an instrument manufacturer. WS:Practice
Random Errors • Arise from the imprecision of measurements and lead to readings being above or below the ‘true’ value.
Random Errors are caused by • The readability of the measuring instrument. • The effects of changes in the surroundings such as temperature variations and air currents. • Insufficient data. • The observer misinterpreting the reading.
Minimizing Random Errors By • using more precise measuring equipment • repeating measurements so that te random errors cancel out.
Systematic Errors • Arise from a problem in the experiment set-up that results in the measured values deviating from the ‘true’ value in the same direction, that is always higher or always lower.
Examples of Systematic Errors • Miscalibration of a measuring device. • Measuring the volume of water from the top of the meniscus rather than the bottom will lead to volumes which are too ________. • Overshooting the volume of a liquid delivered in a titration will lead to volumes which are too ______ . • Poor insulation in calorimetry experiments
Minimizing Systematic Errors • Control the variables in your lab. • Design a “perfect” procedure ( not ever realistic)
Percentage Uncertainty & Percentage Error Systematic error can be identified by comparison with accepted literature values.
Practice Qn • Density = • Percentage uncertainty of • Mass • Volume • Density (c) Percentage error
Comment on the error • The percentage error (4.5%) is greater than thepercentage uncertainty (2.9%) • The literature value does not fall within the range 0.63 +/- 0.02 g/ml. • Since random error is estimated by the uncertainty and it is smaller than the percentage error, systematic errors are at work making the measured data inaccurate.
Data from Preparation of a Standard Solution ( Electronic Balance is accurate to ) Mass of anhydrous Na2CO3 = Titration ( Burette is accurate to ) ( Measuring cylinder is accurate to ) of Na2CO3 is titrated with HCl.
Percentage uncertainties due to measurements Mass of Na2CO3 = Volume of HCl = Volume of Na2CO3 = Total percentage uncertainty
How do we quote the value in the report? Molarity of HCl from experiment = Absolute uncertainty of molarity of HCl Therefore the concentration of HCl is
Comparing % error & % random uncertainty Since the percentage error (55.45%) is greater than the percentage random uncertainty (5.837%), it is suggested that the experiment involves some systematic errors.
Example A mercury thermometer could measure the normal boiling temperature of water as 99.50C (±0.50C) whereas A data probe recorded it as 98.150C (±0.050C) . Which is more accurate? more precise?
If all the temperature reading is 200C but the true reading is 190C . This gives us a precise but inaccurate reading. If you have consistently obtained a reading of 200C in five trials. This could mean that your thermometer has a large systematic error. systematic error accuracy random error precision
systematic error accuracy random error precision
Graphical Technique • y-axis : values of dependent variable • x-axis : values of independent variables
Plotting Graphs • Give the graph a title. • Label the axes with both quantities and units. • Use sensible linear scales – no uneven jumps. • Plot all the points correctly. • A line of best fit should be drawn clearly. It does not have to pass all the points but should show the general trend. • Identify the points which do not agree with the general trend.
Graphs can be useful to us in predicting values. • Interpolation – determining an unknown value within the limits of the values already measured. • Extrapolation – requires extending the graph to determine an unknown value that lies outside the range of the values measured.