Download
1 / 29
290 likes | 432 Views
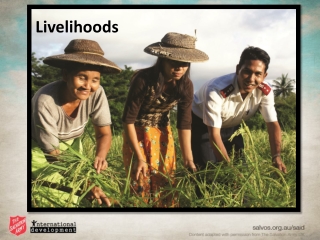
Social Protection and Livelihoods Thematic Area. FANRPAN Partners’ Meeting 13 June 2011, Pretoria, South Africa. Background. Failure of agriculture in Africa to secure livelihoods for 70% of its population that depends on it for survival

E N D
Social Protection and LivelihoodsThematic Area FANRPAN Partners’ Meeting 13 June 2011, Pretoria, South Africa
Background • Failure of agriculture in Africa to secure livelihoods for 70% of its population that depends on it for survival • 1/3 of population suffering from chronic poverty and malnutrition • Continent not on course to eradicate extreme poverty and hunger (MDG1)
Social Protection A framework for public and private initiatives that: • provide income or consumption transfers to the poor; • protect vulnerable populations against livelihood risks; and • enhance the social status and rights of marginalized populations.
Why Social Protection? • Increasing poverty and vulnerability in Africa due to factors that include: • Changing climate • Poor macro-economic performance • Escalating food prices • Diseases (e.g., HIV and AIDS) • Social unrest and civil strife • Effective social protection contributes to fair growth, social stability and enhanced productivity • But, who are the vulnerable?
Why Social Protection? • Households have varying degrees of vulnerability • There is need to quantify the vulnerability levels of households • Data on household vulnerability is often not available at local levels to inform the implementation of development, relief and advocacy programmes • Baselinesurveys are based on samples • they are fragmented and not longitudinal • Lack of reliable evidence to inform policy processes and practice
The HVI Tool • The HVI is a composite index used to assess a household’s access to five livelihoods capitals, namely: • Natural assets such as land, soil and water; • Physical assets such as livestock, equipment and fixed assets; • Financial assets such as savings, salaries, remittances or pensions; • Human assetssuch as farm labour, gender composition and dependents; and • Social assets such as information, community support, extended families and formal or informal social welfare support • A total of 15 variables (called dimensions) are assessed together, and a statistical score is calculated for each household.
Household vulnerability categories The HVI places households in one of 3 categories: • Low vulnerability – those able to cope without external assistance • Moderate vulnerability – those ordinarily able to cope, but require assistance when affected by a temporary shock, e.g. drought • High vulnerability – those that always depend on external assistance to survive (the chronically poor or food insecure)
The HVI Pilot Project • Aim • To improve the quality of programme design, implementation, monitoring and evaluation • Objectives • developing livelihoods databases for pilot sites in each of the three participating countries • institutionalise and scale up the HVI tool • Output • Livelihoods databases on asset ownership by rural communities to inform policy and practice
HVI Pilot Outcomes • Improved targeting and prioritisation due to availability of empirical data • Community participation, enhancing bottom-up learning • Linking research to practice - partnership with local universities • Monitoring of impact of interventions • Evidence-based programming and policy advice
Panellists • World Vision Lesotho: Thato Lepele • World Vision Swaziland: Dalton Nxumalo
Take home message • You cannot change what you cannot measure! • HVI provides an objective tool for assessing household vulnerability • Results from HVI assessments are useful in informing policy processes and programming (baselines, targeting, monitoring, evaluation) • Cost of HVI assessment: less than $15 per household (incl. data collection, analysis, GIS mapping, etc.) • Opportunities for development and funding partners to support roll out of the HVI beyond the pilot sites and pilot countries
“Like slavery and apartheid, poverty is not natural. It is man-made, and it can be overcome and eradicated by the actions of human beings. And overcoming poverty is not a gesture of charity. It is an act of justice.”Nelson Mandela