Download
1 / 86
860 likes | 1.59k Views
IV. Intersection : what we know, would like to know, will never know, and what can we contribute to the debate. III. Atmospheric & Ocean Biogeochemistry : Second element of climate and environmental science Atmospheric and ocean composition, past and present Human impact, global change.

E N D
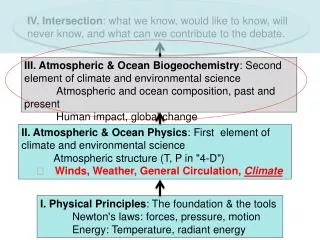
IV. Intersection: what we know, would like to know, will never know, and what can we contribute to the debate. III. Atmospheric & Ocean Biogeochemistry: Second element of climate and environmental science Atmospheric and ocean composition, past and present Human impact, global change II. Atmospheric & Ocean Physics: First element of climate and environmental science Atmospheric structure (T, P in "4-D") Winds, Weather, General Circulation, Climate I. Physical Principles: The foundation & the tools Newton's laws: forces, pressure, motion Energy: Temperature, radiant energy
BioGEOCHEMICAL CYCLES Most abundant elements: oxygen (in solid earth!), iron (core), silicon (mantle), hydrogen (oceans), nitrogen, carbon, sulfur… The elemental composition of the Earth has remained essentially unchanged over its 4.5 Gyr history Extraterrestrial inputs (e.g., from meteorites, cometary material) have been relatively unimportant Escape to space has been restricted by gravity Biogeochemical cyclingof these elements between the different reservoirs of the Earth system determines the composition of the Earth’s atmosphere and oceans, and the evolution of life THE EARTH: ASSEMBLAGE OF ATOMS OF THE 92 NATURAL ELEMENTS
BIOGEOCHEMICAL CYCLING OF ELEMENTS:examples of major processes Physical exchange, redox chemistry, biochemistry are involved Surface reservoirs
HISTORY OF EARTH’S ATMOSPHERE N2 CO2 H2O O2 O2 reaches current levels; life invades continents oceans form CO2 dissolves Life forms in oceans Onset of photosynthesis Outgassing 4.5 Gy B.P 4 Gy B.P. 0.4 Gy B.P. 3.5 Gy B.P. present
Source: EARLY EARTH Oxygen for heavy-metal fans: Lyons TW, Reinhard CT NATURE Volume: 461 Issue: 7261 Pages: 179-181 SEP 10 2009
COMPARING THE ATMOSPHERES OF EARTH, VENUS, AND MARS Venus Earth Mars Radius (km) 6100 6400 3400 Surface pressure (atm) Mass (1024 kg) 91 4.87 1 5.98 0.007 0.64 CO2 (mol/mol) 0.96 3x10⁻⁴ 0.95 N2 (mol/mol) 3.4x10⁻² 0.78 2.7x10⁻² O2 (mol/mol) 6.9x10⁻⁵ 0.21 1.3x10⁻³ H2O (atm, mol/mol) 3x10⁻³ 1x10⁻² 3x10⁻⁴ H2O (total, bars) 0.3 400 2 x 10⁻⁶
Atmospheric Composition (average)1 ppm= 1x10⁻⁶red = increased by human activity Gas Mole fraction Nitrogen (N2) 0.78 Oxygen (O2) 0.21 Water (H2O) 0.04 to < 5x10⁻³; 4x10⁻⁶ -strat Argon (Ar) 0.0093 Carbon Dioxide (CO2) 385 370x10-6 (date: 2009 2000) Neon (Ne) 18.2x10⁻⁶ Ozone (O3) ¶ 0.02x10⁻⁶ to 10x10 –6 Helium (He) 5.2x10⁻⁶ Methane (CH4) 1.7x10⁻⁶ Krypton (Kr) 1.1x10⁻⁶ Hydrogen (H2) 0.55x10⁻⁶ Nitrous Oxide (N2O) 0.32x10⁻⁶ Carbon Monoxide (CO) 0.03x10⁻⁶ to 0.3x10⁻⁶ Chlorofluorocarbons 3.0x10⁻⁹ Carbonyl Sulfide (COS) 0.1x10⁻⁹ ¶ Ozone has increased in the troposphere, but decreased in the stratosphere.
How is the composition of Earth's atmosphere controlled by geochemical and biological processes ?
FAST OXYGEN CYCLE: ATMOSPHERE-BIOSPHERE Source of O2: photosynthesis nCO2 + nH2O -> (CH2O)n + nO2 Sink: respiration/decay (CH2O)n + nO2 -> nCO2 + nH2O CO2 O2 lifetime: 5000 years Photosynthesis less respiration O2 orgC orgC decay litter
…however, abundance of organic carbon in biosphere/soil/ocean reservoirs is too small to control atmospheric O2 levels
SLOW OXYGEN CYCLE: ATMOSPHERE-LITHOSPHERE O2 lifetime: 3 million years O2: 1.2x10⁶ Pg O CO2 O2 Photosynthesis decay runoff Fe2O3 H2SO4 weathering CO2 O2 orgC FeS2 OCEAN CONTINENT orgC Uplift burial CO2 orgC: 1x10⁷ Pg C FeS2: 5x10⁶ Pg S microbes FeS2 orgC SEDIMENTS Compression subduction
Antarctic Ice Core Data CO2 varies over geologic time, within the range 190 – 280 ppm for the last 420,000 years. The variations correlate with climate: cold low CO2 . Is CO2 driving climate or vice versa? The heavier temperature lines 160,000 BP to present reflect more data points, not necessarily greater variability. Source: Climate and Atmospheric History of the past 420,000 years from the Vostok Ice Core, Antarctica, by Petit J.R., Jouzel J., Raynaud D., Barkov N.I., Barnola J.M., Basile I., Bender M., Chappellaz J., Davis J. Delaygue G., Delmotte M. Kotlyakov V.M., Legrand M., Lipenkov V.M., Lorius C., Pépin L., Ritz C., Saltzman E., Stievenard M., Nature, 3 June 1999.
Notice: • atmospheric increase is ~50% of fossil fuel emissions • significant interannual variability Arrows indicate El Nino events
6 8 PgC/yr GLOBAL PREINDUSTRIAL CARBON CYCLE Inventories in Pg C Flows in Pg C a-1 The carbon cycle can be viewed as a set of "reservoirs" or compartments, each characterizing a form of C (e.g. trees; rocks containing calcium carbonate [limestone]). The cycle of C globally is then represented as a set of transfer rates between compartments. The total amount of carbon in the atmosphere + ocean + rocks that exchange with the atmosphere/ocean is fixed by very long-term geophysical processes. Human intervention may be regarded as manipulation of the rates of transfer between important reservoirs.
Carbon Cycle on Land • Photosynthesis: CO2 + H2O + light => "H2CO" + O2 • Respiration: "H2CO" + O2 => CO2 + H2O + energy Very little organic matter is stored, on average. Carbon Cycle in the ocean • Dissolution/evasion CO2(g) + H2O + CO3(aq) = 2 HCO3¯
Global CO2 budget (PgC yr-1 ) 1980 – 1990 1990 –2000 Fossil Fuel+ cement 5.3 Deforestation 1-2 Total 6.3 - 7.3 Atmospheric accumulation 3.2 Ocean uptake 2.1 "Missing Sink" 1-2 Total 6.3 - 7.3 6.5 .5-1 7-7.5 Sources 3.2 1.5-2 1.8-2.8 7-7.5 Sinks 2.1 Pg C = 1 ppm atmospheric CO2[source: Cias et al., Science 269, 1098, (1995)]
Composition of Sea Water Charge balance in the ocean: [HCO3-] + 2[CO32-] = [Na+] + [K+] + 2[Mg2+] + 2[Ca2+] - [Cl-] – 2[SO42-] – [Br-] The alkalinity [Alk] ≈ [HCO3-] + 2[CO32-] = 2.3x10⁻³M "alkalinity" defines Σ' Zi [i] : response of H+ and OH- to addition of CO2
Alkalinity [alk] = Σi Z+[i+] - Σi Z-[i-] = [HCO3-] + 2 [CO3=] [alk] is a re-arrangement of the charge balance equation. It cannot change when adding or removing an uncharged species like CO2. [alk] = 2 x 10⁻³ M -- only 1 in 1000 of total ions!
CO2(g) CO2.H2O CO2.H2O HCO3- + H+ ATMOSPHERE UPTAKE OF CO2 BY THE OCEANS KH = 3x10⁻² M atm-1 OCEAN K1 = 9x10⁻⁷ M Ocean pH = 8.2 pK1 K2 = 7x10⁻¹⁰ M HCO3- CO32- + H+ pK2 CO2.H2O HCO3- CO32-
Equilibrium calculation for [Alk] = 2.3x10⁻³ M CaCO3 Ca2+ + CO32- 100 200 300 400 500 CO2(g) + CO32 + H2O 2HCO3- pCO2 , ppm LIMIT ON OCEAN UPTAKE OF CO2:CONSERVATION OF ALKALINITY Charge balance in the ocean: [HCO3-] + 2[CO32-] = [Na+] + [K+] + 2[Mg2+] + 2[Ca2+] - [Cl-] – 2[SO42-] – [Br-] The alkalinity [Alk] ≈ [HCO3-] + 2[CO32-] = 2.3x10⁻³M is the excess base relative to the CO2-H2O system It is conserved upon addition of CO2 • uptake of CO2 is limited by the existing supply of CO32-: Increasing Alk requires dissolution of sediments: 2.1 2.0 [CO2.H2O]+[HCO3-] +[CO32-], 10-3M 1.9 1.8 [HCO3-], 10-3M 1.6 1.4 4 [CO32-], 10-4 M 3 2 8.6 Ocean pH 8.4 8.2 …which takes place over a time scale of thousands of years
EQUILIBRIUM PARTITIONING OF CO2BETWEEN ATMOSPHERE AND GLOBAL OCEAN Equilibrium for present-day ocean: • only 3% of total inorganic carbon is currently in the atmosphere But CO2(g) k [ [H+] k [ F k … positive feedback to increasing CO2 Pose problem differently: how does a CO2additiondN partition between the atmosphere and ocean at equilibrium? [ 28% of added CO2 remains in atmosphere!
FURTHER LIMITATION OF CO2 UPTAKE: SLOW OCEAN TURNOVER (~ 200 years) Uptake by oceanic mixed layer only (VOC= 3.6x10¹⁶ m3) would givef = 0.94 (94% of added CO2 remains in atmosphere) Inventories in 1015 m3 water Flows in 1015 m3 yr-1
Observed uptake of fossil fuel CO2 by the oceans compare to ~300 moles CO3=
7800 in 2005! 8200 in 2007! 6500 1990 Global Fuel Use 1980 1970 3800 History of consumption of fossil fuels. Emissions have increased by more than 2X since 1970. There rise in the last 5 years has been really dramatic. But there has not been a corresponding rise in the annual increment of CO2. In 1970 ~75% of the emitted CO2 stayed in the atmosphere, but only ~40% in 2000. 1960 1950 Year
US fossil fuel use The US is the largest consumer of fossil fuels. Per capita use is very high, ~5 tons C per person per year. This rate has not changed much in 50 years. 109 metric tons of C / yr 0 .5 1. 1.5 (source: CDIAC –Trends –updated)
Metric tons C per person US per capita fossil fuel use
US and World Per Capita Fossil Fuel Use since 1950 Why don't we see a big upswing due to the emergence of economies in China and India ?
NET UPTAKE OF CO2 BY TERRESTRIAL BIOSPHERE(1.4 Pg C yr-1 in the 1990s; IPCC [2001])is a small residual of large atm-bio exchange Gross primary production (GPP): GPP = CO2 uptake by photosynthesis = 120 PgC yr-1 Net primary production (NPP): NPP = GPP – “autotrophic” respiration by green plants = 60 PgC yr-1 Net ecosystem production (NEP): NEP = NPP – “heterotrophic” respiration by decomposers = 10 PgC yr-1 Net biome production (NBP) NBP = NEP – fires/erosion/harvesting = 1.4 PgC yr-1 CO2 + H2O "H2CO" + O2Photosynthesis and Respiration Atmospheric CO2 observations show that the net uptake is at northern midlatitudes but cannot resolve American vs. Eurasian contributions
CYCLING OF CARBON WITH TERRESTRIAL BIOSPHERE Inventories in PgC Flows in PgC yr-1 Relatively small reservoirs Short time scales net uptake from reforestation is transitory. ..unless resources are managed to preserve organic matter
Carbon-Climate Futures Vegetation matters! Different models project dramatically different futures using different ecosystem models. ~ 2º K in 2100 Coupled simulations of climate and the carbon cycle
PROJECTED FUTURE TRENDS IN CO2 UPTAKEBY OCEANS AND TERRESTRIAL BIOSPHERE IPCC [2001]
C4MIP: coupled climate-biosphere model comparison (used in IPCC 2007)