Download
1 / 25
250 likes | 380 Views
Least invasive beam profile measurements: Ionization Profile Monitors and Beam Induced Fluorescence P . Forck , C. Andre, F. Becker, T. Giacomini , Y. Shutko , B . Walasek -H öhne GSI Helmholtz- Zentrum f ür Schwerionenforschung , Darmstadt, Germany

E N D
Least invasive beam profile measurements: Ionization Profile Monitors and Beam Induced Fluorescence P. Forck, C. Andre, F. Becker, T. Giacomini, Y. Shutko, B. Walasek-Höhne GSI Helmholtz-Zentrum fürSchwerionenforschung, Darmstadt, Germany In collaboration with: T. Dandl, T. Heindl, A. Ulrich, Technical University München J. Egberts, J. Marroncle, T. Papaevangelouet al., CEA/Saclay OPAC Workshop Vienna, May 8th, 2014 • Outline of the talk: • Ionization Profile Monitor IPM technical realization • Beam based measurements at GSI synchrotron and storage ring • Beam Induced Fluorescence BIF monitor realization • Energy scaling of signal and background 60MeV/u < Ekin< 750MeV/u • Spectroscopic investigations for rare gases andN2 • Profiles & spectroscopy for pressure range 10-3 mbar < p < 30 mbar • Comparison IPM BIF
Expected Signal Strength for IPM and BIF-Monitor Energy loss in10-7 mbar N2by SRIM • Physics: • Energy loss of ions in gas dE/dx • Profile determination from residual gas • Ionization:roughly 100 eV/ionization • Excitation + optical photon emission: roughly 3 keV/photon LINAC, cyclotron ion source synchrotron Ionization probability proportional to dE/dxby Bethe-Bloch formula: Target electrondensity: Proportional to vacuum pressure Adaptation of signal strength 1/Ekin(forEkin> 1GeV nearly constant)
Expected Signal Strength for IPM and BIF-Monitor Energy loss in10-7 mbar N2by SRIM • Physics: • Energy loss of ions in gas dE/dx • Profile determination from residual gas • Ionization:roughly 100 eV/ionization • Excitation + optical photon emission: roughly 3 keV/photon • Energy loss for l 1m: dE/dx l <<E kin • acceptable for single pass beams • Care: synchr.multi pass; cryogenic envir. 238U 40Ar 12C 1H Ionization probability proportional to dE/dxby Bethe-Bloch formula: Target electrondensity: Proportional to vacuum pressure Adaptation of signal strength 1/Ekin(forEkin> 1GeV nearly constant) Strong dependence on projectile charge for ions Zp2 Modification proton ions:Zp(Ekin) . Charge equilibrium is assumed for dE/dx
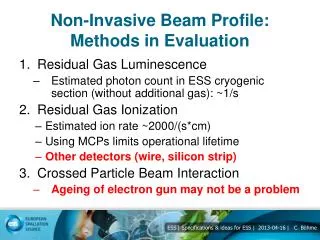
CCD Ion beam Light Phosphor Electrons MCP 2 MCP 1 Channels 10 m Residual gas ion Ionization Profile Monitor: Principle • Advantage: ‘4-detection scheme’ for ionization products • Detection scheme: • Secondary e- or ions accelerated by E-field • electrodes & side strips E 50… 300 kV/m • MCP (Micro Channel Plate) electron converter & 106-fold amplifier • eitherPhosphor screen & CCD high spatial resolution of 100 m • orwire array down to 250 m pitch high time resolution IPMs are installed in nearly all synchrotrons However, no ‘standard’ realization exists!
Insertion 650 mm IPM support & UV lamp Ø250 mm Horizontal IPM: Vertical IPM E-field box Electrodes 175mm beam Vertical camera MCP E-field separation disks View port Ø150 mm Horizontal camera Ionization Profile Monitor Realization at GSI Storage Ring The realization for the heavy ion storage ring ESR at GSI:
IPM: Multi Channel Plate MCP for Synchrotron Installation MCP are used as particle detectors with secondary electron amplification. • A MCP is: • 1 mm glass plate with 10 μm holes • thin Cr-Ni layer on surface • voltage 1 kV/plate across • e− amplification of 103 per plate. • resolution 0.1 mm (2 MCPs) Electron microscope image: • Anode technologies: • SEM-grid, 0.5 mm spacing • limited resolution • fast electronics readout • phosphor screen + CCD • high resolution, but slow timing • fast readout by photo-multipliers 20 m • Challenges: • Fast readout with < 100 ns resolution • Proper MCP holder design • Calibration for sensitivity correction • HV switching of MCP to prevent for destruction
|5 injections + cooling | | acc.| horizontal IPM: Observation of Cooling and Stacking Example: U73+beam at GSI for intensity increase stacking by electron cooling and acc. 11.4 400 MeV/u IPM: Profile recording every 10 ms measurement within one cycle. • Task for IPM: • Observation of cooling • Emittance evaluation during cycle V. Kamerdzhiev (FZJ) et al., IPAC’11 P. Forck (GSI) et al., DIPAC’05
un-matched matched 9th turn 1st turn -40 -20 0 20 40 -40 -20 0 20 40 IPM: Turn-by-Turn Measurement Example: Injection to J-PARC RCS at 0.4 GeV Anode: wire array with 1mm pitch • Important application: • Injection matching • to prevent for emittance enlargement • Observation during ‘bunch gymnastics’ • turn–by-turn measurement Required time resolution 100 ns Turn-by-turn IPMs at BNL, CERN, FNAL etc. Not realized at GSI yet! H. Hotchi (J-PARC), HB’08, A Satou (J-PARC) et al., EPAC’08
IPM: Space Charge Influence for Intense Beams Ion detection:For intense beams broadening due to space charge Electron detection: B-field required for e- guidance toward MCP. Effects:3-dim start velocity of electrons Ekin(90%) < 50 eV, max 900 rcyl< 100 m for B 0.1 T ion detection B-field & electron detection Monte-Carlo simulation: Ion versus e- detection 1012 charges Only e- scheme gives correct image
Vertical IPM 300mm Horizontal IPM Corrector Insertion length 2.5 m IPM: Magnet Design Corrector Magnetic field for electron guidance: • Maximum image distortion: • 5% of beam width B/B < 1 % • Challenges: • HighB-fieldhomogeneity of 1% • Clearance up to 500 mm • Corrector magnets required to compensate beam steering • Insertion length 2.5 m incl. correctors For MCP wire-array readout lower clearance required 480mm • At transfer line: • Vacuum pressure up to 10-5 mbar • IPM without MCP realized • much less mechanical efforts Design by G. de Villiers (iThemba Lab), T. Giacomini (GSI) Further types of magnets e.g. K.Satou (J-PARC) et al., EPAC’08, J.Zagel (FNAL) et al., PAC’01, R.Connolly (RHIC) et al., PAC’01, C. Fischer (CERN) et al. BIW’04
Vertical IPM 300mm Horizontal IPM Corrector Insertion length 2.5 m IPM: Magnet Design Corrector Magnetic field for electron guidance: Maximum image distortion: 5% of beam width B/B < 1 % 480mm Design by G. de Villiers (iThemba Lab), T. Giacomini (GSI) Further types of magnets e.g. K.Satou (J-PARC) et al., EPAC’08, J.Zagel (FNAL) et al., PAC’01, R.Connolly (RHIC) et al., PAC’01, C. Fischer (CERN) et al. BIW’04
Summary Ionization Profile Monitor • Status: • Non-destructive method in operation in nearly all hadron synchrotrons • Proposed or operated in some hadron LINACs (often without MCP) • Physics well understood • For high beam current i.e. high space charge field magnet B 0.1 T required • long insertion length • MCP efficiency drops significantly during high current operation • efficiency calibration & HV switching required • Challenges (no standard realization exists) : • High voltage (up to 60 kV) realization for intense beams • Stable operation for MCP incl. efficiency calibration • Design and tests for correction algorithm for space charge broadening • Remark: • Gas curtain monitor with well localized gas volume realized • Comparable deviceused for synchrotron light monitorrealized
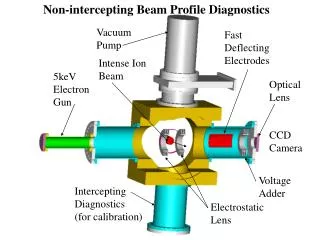
N2-fluorescent gas equally distributed Vacuum gauge Blackened walls Valve 150mm flange Ionbeam Viewport Lens, Image-Intensifier and CCD FireWire-Camera Beam Induced Fluorescence Monitor: Principle Detecting photonsfrom residual gas molecules, e.g. Nitrogen N2 + Ion (N2+)*+ Ion N2+ + + Ion 390 nm< < 470 nm emitted into solid angle to camera single photon detection scheme • Features: • Single pulse observation possible down to 1 s time resolution • High resolution (here 0.2 mm/pixel) can be easily matched to application • Commercial Image Intensifier • Less installations inside vacuum as for IPM compact installation e.g. 20 cm for both panes Beam: 4x10¹⁰Xe48+ at 200MeV/u, p=10-3 mbar
Horizontal BIF Image Int. CCD Vertical BIF Beam Photocathode e- double MCP Phosphor many BIF-Monitor: Technical Realization at GSI LINAC • Six BIF stations at GSI-LINAC (length 200m): • 2 x image intensified CCD cameras each • double MCP (‘Chevron geometry’) • Optics with reproduction scale 0.2 mm/pixel • Gas inlet + vacuum gauge • Pneumatic actuator for calibration • Insertion length 25 cm for both directions only • Advantage: single macro-pulse observation Image intensifier F. Becker (GSI) et al., Proc. DIPAC’07, C. Andre (GSI) et al., Proc. DIPAC’11
Energy Scaling behind SIS18 at GSI Ekindependence for signal & background close to beam-dump: 60 MeV/u Image from 1·109 U p= 2·10-3 mbar, mounted ≈ 2 m before beam-dump: 350 MeV/u viewport 750 MeV/u • Signal proportional to energy loss • Suited for FAIR-HEBT with ≥ 1010 ions/pulse • Background prop. Ekin2 shielding required • Background suppression by 1 m fiber bundle F. Becker (GSI) et al., Proc. DIPAC’07
BIF-Monitor: Spectroscopy–Fluorescence Yield Beam: S6+ at 5.16 MeV/u, pN2 =10-3 mbar Results of detailed investigations: • Rare gases andN2: green to near-UV • Compact wavelength interval for N2 • Fluorescence yield: N2 4x higher as rare gases N2 and Xe are well suited ! Relative fluorescence yield Y(all wavelength): ne:gas electron densityenergy loss beam influence F. Becker (GSI) et al., Proc. DIPAC’09, Collaboration with TU-München
BIF-Monitor: Spectroscopy–Profile Reading Beam: S6+ at 5.16 MeV/u, pN2 =10-3 mbar Results of detailed investigations: • Rare gases andN2: green to near-UV • Compact wavelength interval for N2 • Fluorescence yield: N2 4x higher as rare gases • Same profile reading for all gas except He N2 and Xe are well suited ! Normalized profile reading for all : Profile reading equal for all gases except He F. Becker (GSI) et al., Proc. DIPAC’09, Collaboration with TU-München
Spectroscopy – Excitation by different Ions For N2 working gas the spectra for different ion impact is measured: Results: • Comparable spectra for all ions • Small modification due to N2+ dissociation by heavy ion impact • Results fits to measurements for proton up to 100 GeV at CERN • Stable operation possible for N2 Care: Different physics for Ekin < 100 keV/u vcoll < v Bohr Different spectra measured M. Plum et al., NIM A (2002) & A. Variola, R. Jung, G. Ferioli, Phys. Rev. Acc. Beams (2007),
Image Spectroscopy – Different Gas Pressures and Profile Width N2 Observation: Trans. of ionic states e.g. N2+ profile width independent on pressure Trans. of neutral states e.g. N2 width strongly dependent on pressure! p = 0.003 mbar • Ionic transitions =391 nm: • N2 + ion(N2+)* +e-+ ionN2++ +e- + ion • N2+ @391nm: B2+u(v=0) X2+g(v=0) • large σ for ion-excitation, low for e- N2 p = 0.1 mbar N2 N2 trans. @337 nm p = 30 mbar • Neutral transitions =337 nm: • N2 + e- (N2)* + e- N2 + + e- • N2 @337nm: C3u(v=0) B3g(v=0) • large σ of e- excitation., low for ions • at p 0.1 mbar free mean path 1 cm! N2+ trans.@391 nm F. Becker et al., IPAC’12 &HB’12
Image Spectroscopy – Different Gas Pressures and total Profile Width Beam: S at 3 MeV/u at TU-München TANDEM Entire spectral range effect is smaller but significant disturbance for He and Ne Task: To which pressure the methods delivers a correct profile reproduction? Results: • avoid 10-2 mbar < p < 10 mbar • chose either rmfp >> rbeam or rmfp<< rbeam • use transition of the charged specious all transitions 10-2 mbar rmfp~30 mm 10-1 mbar rmfp~ 3 mm 10+1 mbar rmfp~ 30 m 30mm 100mm F. Becker et al., IPAC’12 and HB’12
Alternative Single Photon Camera: emCCD Principle of electron multiplication CCD: I= 60 A Ni13+: tpulse= 1.2 ms p=10-4 mbar Results: Suited for single photon detection x5 higher spatial resolution as ICCD less beam-induced background more noise due to electrical amplification Acts as an alternative Multiplication by avalanche diodes: • Parameter of Hamamatsu C9100-13 • Pixel: 512x512, size16x16m2 , -80 OC • Maximum amplification: x1200 • Readout noise: about 1 e- per pixel F. Becker et al., BIW’08
Summary Beam Induced Fluorescence Monitor • Non-destructive profile method in operation for E < 11 MeV/u for typ. p < 10-5 mbar • Considered for higher beam energies E > 100 MeV/u ongoing • Independence of profile reading for pressures up to 10-2mbar for N2, Xe, Kr, Ar • N2is well suited: blue wavelength, high light yield, good vacuum properties • Xe is an alternative due to 10-fold shorter lifetime: less influence in beam’s E-field • He is excluded as working gas due to wrong profile reproduction • Modern emCCD might be an alternative • Topics under development: • Investigation of shielding and radiation hardness of components • Modeling of atomics physics processes for different pressure ranges • Generally: Method proposed or used for: • High current hadron LINAC (e.g. LIPAc, FRANZ, IPHI.....) • Proton synchtrotrons (e.g. CERN...) • Electron sources, LINACs and e-coolers (e.g. Uni-Mainz...)
Comparison BIF IPM at GSI LINAC with 4.7 MeV/u Xe21+ • Test with LIPAc design and various beams • Comparison IPM without MCP and BIF • Advantage IPM:10 x lower threshold as BIF • Disadvantage IPM:Complex vacuum installation, image broadening by beam’s space charge Design by CEA for LIPAc Collaboration with J. Egberts, J. Marroncle, T. PapaevangelouCEA/Saclay J. Egberts (CEA) et al., DIPAC’11, F. Becker (GSI) et al , DIPAC’11 Beam: 1.1 mA Xe21+, 4.7 MeV/u
Comparison BIF IPM for He Gas • Variation of Helium gas pressure: • Profile broadening for both detectors • Large effect for BIF (emission of photons) • Comparison to SEM-Grid and BIF • Helium is not suited as working gas for BIF & IPM Design by CEA for LIPAc Collaboration with J. Egberts, J. Marroncle, T. PapaevangelouCEA/Saclay J. Egberts (CEA) et al., DIPAC’11, F. Becker (GSI) et al , DIPAC’11 Beam: 1.1 mA Xe21+, 4.7 MeV/u
Simplified Comparison of BIF and IPM Method Comparison for application at high current hadron LINAC, transport lines & synchrotrons Thank you for your attention !