Download
1 / 51
510 likes | 623 Views
BLM National and State Offices Meeting on WestJumpAQMS. Ralph Morris, ENVIRON International Corporation Tom Moore, Western Regional Air Partnership Millennium Harvest House Hotel Boulder, Colorado 9:30-11:30 -- July 8, 2013. Background.

E N D
BLM National and State Offices Meeting on WestJumpAQMS Ralph Morris, ENVIRON International Corporation Tom Moore, Western Regional Air Partnership Millennium Harvest House Hotel Boulder, Colorado 9:30-11:30 -- July 8, 2013
Background • Western Regional Air Partnership (WRAP) initiated the West-wide Jump Start Air Quality Modeling Study (WestJumpAQMS) to: • Initiate next generation of regional technical analysis for ozone planning in the western U.S. • Develop next generation modeling platforms to address BLM NEPA oil and gas development and other activities for EISs/RMPs • Continue work conducted at the WRAP Regional Modeling Center (RMC) and leverage recent air modeling studies • Provide a preliminary assessment of the role of ozone transport to elevated ozone concentrations across the West • As well as PM2.5, visibility and deposition
Background • WestJumpAQMS Website with products to date • http://www.wrapair2.org/WestJumpAQMS.aspx
Ozone Planning for Oil and Gas Development • Prior to ~2007 ozone assessments in O&G EISs were based on qualitative analysis and the 1988 Scheffe Point Source Screening Table • Scheffe Tables denounced by Dr. Scheffe in 2006 • Measured ozone exceedances in the Jonah Pinedale Anticline Development (JPAD) O&G area in 2005/2006 • SEIS for Pinedale Anticline O&G Exploration and Development Project first to address ozone using a Photochemical Grid Model (PGM) (final Dec 2007) • Leveraged off of the WRAP Regional Model Center (RMC) 2002 database to perform CAMx 2002 4 km ozone modeling
Continental Divide-Creston (CD-C) EIS • April 2007 CD-C Air Kickoff meeting in Cheyenne with WDEQ, EPA R8, BLM, FLMs, Environmentalists, etc. • Unanimous agreement to use CAMx PGM for ozone and far-field air quality and AQRV • CALPUFF not needed • Use existing 2005 (FCAQTF) and 2006 36/12/4 km MM5 meteorological data • Draft EIS released December 2012 • Since then numerous other BLM EISs and RMPs have adopted using CAMx PGM ozone and far-field AQ/AQRV • Moxa Arch, Hiawatha, White River, Colorado River Valley, etc.
BLM EISs/RMPs using PGMs • Problems with sharing PGM modeling files among EISs/RMPs • Difficult to share information in a NEPA study that is pre-decisional across different groups • Large size of and no central storage location for databases • Databases poorly documented • WRAP RMC 2002 PGM platform leveraged by early EISs • WestJumpAQMS developed 2008 modeling database • Developed outside of NEPA so able to share with all • Reusable modeling framework • Distributed via Three State Data Warehouse (3SDW)
WestJumpAQMS PGM Inputs for 3 Domains 36 km CONUS 12 km WESTUS 4 km IMWD
WestJumpAQMS Completed Tasks • WRF Application/Evaluation • Evaluation report on WRAP website • 2008 Oil and Gas Emissions Update • WRAP Phase III plus Permian Basins • 16 Emissions Summary Memorandums • Detailed documentation of emissions • SMOKE Emissions Modeling • QA/QC following WRAP Protocol • CAMx Model Input Development • 36 km CONUS BCs from MOZART global model • MOZART vs. GEOS-Chem BC Sensitivity Analysis
WestJumpAQMS Completed Tasks • CAMx 2008 36/12 km Base Case • Model Performance Evaluation • Results on WRAP website and presented in June 20, 2013 progress webinar • CAMx 2008 State-Specific Ozone Source Apportionment Modeling • Preliminary results presented in June 20, 2013 webinar • CSAPR-type upwind state contribution to downwind state ozone nonattainment analysis • State ozone footprint spatial maps • Contributions of Natural, Anthropogenic and Stratospheric Ozone/International Transport to ozone concentrations
WestJumpAQMS Tasks In-Progress • State-Specific PM Source Apportionment Modeling • CAPR-type and state footprint for annual and 24-hour PM2.5 • Also used for visibility and deposition • Source Category-Specific Ozone and PM Source Apportionment • Separate contributions by: (1) Natural; (2) Oil and Gas Development; (3) Fires; (4) Point Sources; (5) Mobile Sources (on- and non-road); and (6) Area Sources • Full-fills a common FLM request at EISs/RMPs Interagency Meetings to obtain the cumulative impacts due to all oil and gas development, only outside of NEPA
WestJumpAQMS Tasks In-Progress • Develop Basin-average 2011 emission factors for oil and gas sources for WRAP Phase III Basins • Used by EPA for developing oil and gas emissions for the 2011 National Emissions Inventory (NEI) to obtain much more accurate O&G emissions for Rocky Mountain states • Transfer WestJumpAQMS database and results to Three State Data Warehouse (3SDW) • 3SDW to develop web-based visualization tool for WestJumpAQMS Source Apportionment results • 3SDW developing procedures for transfer of data to others on request • Draft final report in August 2013
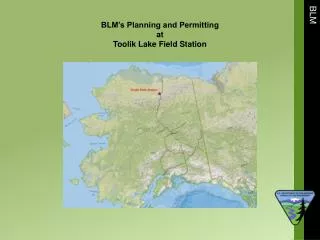
WestJumpAQMS Tasks In-Progress • Development of stand-alone 2008 4 km Impact Assessment Domain (IAD) CAMx Databases • Original plan was to develop four 2008 4 km IAD PGM databases • MT-ND: turns out BLM Montana/Dakotas is pursuing a 2013 modeling year • WY: many EISs in progress using 2005/2006 • UT-CO: UT BLM ARMS addressing 2010 • San_Juan: more linked with western Colorado • BLM COSO needs 2008 IAD 4 km PGM database so that was focus of IAD development
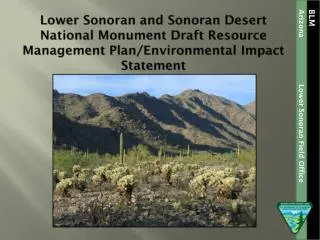
West-CARMMS • Western Colorado Air Resource Management Modeling Study (West-CARMMS) • Initiated by BLM COSO to address the individual and cumulative AQ and AQRV impacts due to several RMPs/EISs in western CO: • Jan 2013 Draft RMP for Grand Junction FO • May 2013 Draft RMP for Dominguez-Escalante NCA • Uncompahgre FO RMP in preparation • Rather than deal with each RMP AQ/AQRV impacts individually as in the past, develop unified consistent approach • Leverage off of WestJumpAQMS 2008 CAMx model database development • Initial West-CARMMS 4 km IAD developed to completely include all Class I areas that are within 200 km of a western Colorado BLM planning area
Mancos Shale Oil Development • Planned development of the Mancos Shale Oil region in the NM BLM Farmington FO needs AQ/AQRV analysis • 400 wells/year in oil prone area in south starting in 2015 • Development of gas prone area in north to occur later • BLM NMSO intends to fund the addition of the Mancos Shale Oil development to West-CARMMS • Cost-effective leveraging of West-CARMMS and WestJumpAQMS
West-CARMMS 4 km Modeling Domain • 4 km Domain to include all Class I areas within 200 km of the Western Colorado and Mancos Shale Oil development areas • WestJumpAQMS will set-up CAMx for 2008 base case on 4 km West-CARMMS IAD and conduct 2008 base case simulation • Model performance evaluation • Transfer PGM database to West-CARMMS modelers
West-CARMMS Tasks • 2011 Baseline and future year (2021) emissions development • AQ/AQRV impacts of each Western Colorado BLM FO and NM FFO planning area as well as cumulative AQ/AQRV impacts • Task 1: Emissions Calculators • Task 2: 2011 and 2021 Emissions • Task 3: Model Setup • Task 4: Baseline/FY CAMx Modeling • Source apportionment used to obtain individual FO AQ/AQRV impacts • Task 5: Reporting and Meetings
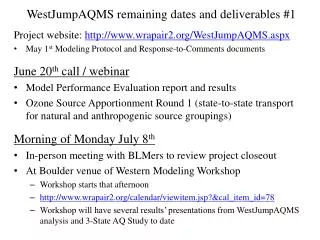
Example WestJumpAQMS Completed Products • On WRAP website (wrapair2.org): • Modeling Protocol • Details on how 2008 modeling will be conducted • WRF meteorological application/evaluation report • 16 Technical Memorandums on the 2008 emissions and emissions modeling • Full documentation of emission sources, procedures and limitations review by technical team • June 20, 2013 interim progress report • Ozone and PM model performance evaluation • Preliminary State-Specific Ozone Source Apportionment modeling results
Summary of CAMx 2008 36/12 km Inputs • WRF 2008 36/12 km Meteorology • MOZART Global Model Boundary Conditions • 2008 Base Case Emissions • WRAP Phase III 2008 Oil and Gas Emissions • 2008 NEI O&G outside of WRAP Basins • MEGAN Biogenic Emissions • Hourly CEM for Electrical Generating Units (EGUs) • 2008 National Emissions Inventory (NEIv2) • Fire INventory from NCAR (FINN) [Base08a&b] • DEASCO3 Fire Emissions (Base08c)
Ozone Model Performance • Daily Maximum 8-Hour Ozone (DMAX8) • Matched by day and location (grid cell) • Scatter Plots of Predicted and Observed DMAX8 with Model Performance Statistics: • Performance Goals • Bias ≤±15% and Error ≤35% • Fractional Bias (FB) and Error (FE) • Normalized Mean Bias (NMB) and Error (NME) • Correlation Coefficient (R2) and Regression Equation • By western state for: • AQS monitors (urban) and CASTNet monitors (rural)
Arizona 36 km (red) and 12 km (blue) DMAX8 • AQS Monitors • NMB = 6% & FB = 7% • NME = 13% & FE = 14% • CASTNet Monitors • NMB = 2% & FB = 2% • NME = 10% & FE = 10%
Colorado 36 km (red) and 12 km (blue) DMAX8 • AQS Monitors • NMB = 9% & FB = 10% • NME = 16% & FE = 17% • CASTNet Monitors • NMB = 9% & FB = 9% • NME = 14% & FE = 14% CASTNet DMAX8 overestimations due to modeled stratospheric ozone intrusions when none occurred [Apr 11 (102), May 8 (129) and Jun 13 (165) – (JDay)] 22 22
Utah 36 km (red) and 12 km (blue) DMAX8 • AQS Monitors • NMB = 7% & FB = 10% • NME = 15 & FE = 17% • CASTNet Monitors • NMB = 1% & FB = 1% • NME = 9% & FE = 9% AQS overestimation at low end due to urban monitoring sites and coarse grid. Very good ozone performance at CASTNet (Canyonlands).
Wyoming 36 km (red) & 12 km (blue) DMAX8 • AQS Monitors • NMB = 4% & FB = 5% • NME = 14% & FE = 13% • CASTNet Monitors • NMB = 3% & FB = 3% • NME = 11% & FE = 10% Model not configured to simulate high winter DMAX8 ozone in JPAD (e.g., 122 ppb at Boulder on Feb 21, 2008). CASTNet likely modeled strat ozone in Apr (PND & YEL)
Summary Base08c DMAX8 Ozone Performance • Mostly reasonable performance with low bias and error (some positive bias tendency) • Larger overestimation bias in WA, NM, OR and MT • MT traced to questionable observed ozone at Glacier CASTNet site going to zero at night • Some occurrences of modeled stratospheric ozone intrusion when none observed (and vice versa) • Underestimation of JPAD winter high ozone and highest ozone in California • Model not configured for simulating cold pooling • Coarse (12 km) grid limits urban ozone simulation, especially in marine environment
State-Specific Ozone Source Apportionment Modeling • 2008 36/12 km Base08c (DEASCO3 fires) scenario • Source Regions: Western States etc. • Source Categories: (1) Natural (Biogenic, Lightning, Sea Salt and WBD); (2) Fire (separately for WF, Rx, AG); and (3) Anthropogenic • CSAPR-type transport analysis • Examine upwind state anthropogenic (Anthro+Rx+Ag) contribution to downwind state ozone and PM2.5 Design Values (DV) • Spatial extent of contributions to high ozone/PM2.5 • Maximum ozone contribution to daily maximum 8-hour ozone ≥ 76, 70, 65, 60 and 0 ppb • Role of Stratospheric Ozone, International Transport, Natural Emissions, Fires and Anthropogenic Emissions
State-Specific Source Apportionment21 Source Regions (17 “western” states)
CSAPR-type Analysis • State-Specific Anthropogenic (Anthro+Rx+Ag) contributions to 8-hour ozone Design Value (DVs) • Model Attainment Test Software (MATS) to project current DVs without a selected state’s contribution • Use relative change in model results to scale observed current year DV (DVC) in absence of a state’s anthropogenic emissions • Difference is state’s ozone contribution at each ozone monitoring site • As in CSAPR, use two sets of DVCs • AvgDVC = Average of 2006-2008, 2007-2009 & 2008-2010 DVs • MaxDVC = Maximum of 2006-08, 2007-09 & 2008-10 DVs • CSAPR used significant contribution threshold of 1% of the NAAQS
MATS Unmonitored Area Analysis (UAA) • Default MATS calculates current year Design Value (DVC) using an average of three Design Values • Design Value (DV) is defined as the three year average of the fourth highest daily maximum 8-hour ozone (DMAX8) • MATS DVC defined as avg of 2006-8, 2007-9 & 2008-10 DVs • MATS UAA interpolates DVCs across domain • Since low ozone in 2009, ozone has been increasing in west Denver DVs 2001-2012
2008 36/12 km State-Specific Analysis • Example CSAPR-type Analysis using current (March 2008) 0.075 ppm ozone NAAQS • Also looking at 70, 65 and 60 ppb potential future NAAQS • 136 ozone monitors in 12 km WESTUS domain with AvgDVC exceeding NAAQS (76 ppb or higher) [86 sites (63%) in CA] • For 17 upwind western states examine 2008 contribution to ozone Design Values at ozone monitoring sites in downwind states: • Number of downwind state monitoring sites with contribution to ozone Design Value greater than 1 % of the NAAQS (# Sites ≥ 0.76 ppb) • Maximum contribution to a downwind state 8-hour ozone Design Value
CSAPR-type Analysis for 0.075 ppm NAAQSNumber of sites with State contribution to DV ≥ 0.76 ppb
Arizona • Highest monitor in five states with DV ≥ 76 ppb and AZ contribution to DV ≥ 0.76 ppb • AvgDV and MaxDV • AZ AvgDV Contribution • 2.35 ppb TX El Paso • 1.32 ppb NM Dona Ana • 1.23 ppb UT Weber • 1.15 ppb CO Jefferson • 1.13 ppb NV Clark
37 California • Highest monitor in five states with DV ≥ 76 ppb and CA contribution to DV ≥ 0.76 ppb • AvgDV and MaxDV • CA AvgDV Contribution • 16.9 ppb NV Clark • 5.3 ppb AZ Pinal • 2.16 ppb UT SLC • 1.89 ppb CO Jefferson • 1.19 ppb TX El Paso
Idaho • Highest monitor in two states with DV ≥ 76 ppb and ID contribution to DV ≥ 0.76 ppb • AvgDV and MaxDV • ID AvgDV Contribution • 1.37 ppb UT Box Elder • 1.02 ppb WY Sublette
39 Nevada • Highest monitor in four states with DV ≥ 76 ppb and NV contribution to DV ≥ 0.76 ppb • AvgDV and MaxDV • NV AvgDV Contribution • 1.27 ppb CA Inyo • 1.12 ppb UT SLC • 0.99 ppb AZ Maricopa • 0.77 ppb CO Jefferson
40 40 New Mexico • Highest monitor in three states with DV ≥ 76 ppb and NM contribution to DV ≥ 0.76 ppb • AvgDV and MaxDV • NM AvgDV Contribution • 2.69 ppb TX El Paso • 1.05 ppb AZ Maricopa • 0.73 ppb CO Douglas
41 41 41 Utah • Highest monitor in one state with DV ≥ 76 ppb and UT contribution to DV ≥ 0.76 ppb • AvgDV and MaxDV • UT AvgDV Contribution • 2.53 CO Jefferson
42 42 42 42 Washington • Highest monitor in one states with DV ≥ 76 ppb and WA contribution to DV ≥ 0.76 ppb • AvgDV and MaxDV • WA AvgDV Contribution • 1.03 WY Sublette • Issues with applying MATS approach for DVs based on winter ozone
43 43 43 43 43 Wyoming • Highest monitor in one state with DV ≥ 76 ppb and WY contribution to DV ≥ 0.76 ppb • AvgDV and MaxDV • WY AvgDV Contribution • 1.53 CO Larimer
State-Specific Ozone Foot Prints • Examine spatial distribution of state’s highest contribution to modeled daily maximum 8-hour ozone concentrations for total modeled ozone greater than or equal to several thresholds: • 76 ppb (current NAAQS); 70 ppb; 65 ppb; 60 ppb; and 0 ppb (highest contribution in year) • Results follow for 0 ppb and 76 ppb • Arizona, California and Colorado presented • Remainder states on WestJumpAQMS website from June 20, 2013 status conference call • http://www.wrapair2.org/pdf/WestJumpAQMS_Progress_Jun20_2013_Draft2.pdf
Arizona Highest 8-Hour Ozone Contribution O3 ≥ 0 ppb O3 ≥ 76 ppb
California Highest 8-Hour Ozone Contribution O3 ≥ 0 ppb O3 ≥ 76 ppb
Colorado Highest 8-Hour Ozone Contribution O3 ≥ 0 ppb O3 ≥ 0 ppb
WestJumpAQMS Next Steps • Finish West-CARMMS database development • Complete State-Specific PM Source Apportionment • Displays of annual and 24-hour PM2.5 (CSAPR-type) • Visibility and Sulfur/Nitrogen Deposition • Discuss on July 17, 2013 status call • Complete Source Category-Specific Ozone and PM Source Apportionment Modeling • Contributions of Natural, Fires, Oil and Gas, Point, Mobile, and Other Sources to O3, PM2.5 and AQRVs • Discuss on August 2013 status call • Final Report and Documentation • Finish in August 2013
Life After WestJumpAQMS • Three State Data Warehouse (3SDW) and Air Quality Study (3SAQS): • CO, UT, WY, EPA, NPS, USFS, FWS, BLM • Grant funding from NPS to: • Tom Moore, 3SDW Technical Coordinator • CSU/CIRA develop 3SDW website • UNC/IE perform modeling and analysis and develop 2011 modeling platform • 3SDW to archive WestJumpAQMS 2008 modeling databases and results • Repository for emissions, AQ observations and modeling • Already tested data retrieval and ability to duplicate results
3SAQS 2013 Scope of Work • 2008 modeling and analysis • 2011 WRF meteorological modeling • 2011 emissions development and modeling • Oil and Gas (O&G) emissions updates • 2011 baseline O&G following WRAP Phase III • Future year O&G emission projections 2012-2030 • Other Future Year emissions projections • Air quality monitoring network assessment • Development of on-line Source Apportionment tool • Development of on-line modeling spatial display tool