Download
1 / 30
300 likes | 461 Views
OXYGEN vs GAS SEEPAGE Areal surveys and monitoring in western Greece. INGV-UPAT 2010-2011 joint activity G. Papatheodorou, G. Etiope D. Christodoulou, N. Lo Bue, S. Kordella, G. Marinaro, …… put here all names you wish…….

E N D
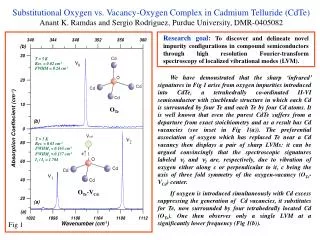
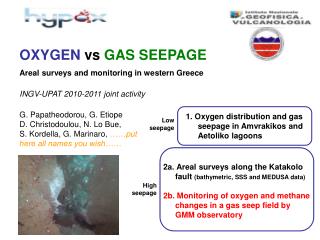
OXYGEN vs GAS SEEPAGE Areal surveys and monitoring in western Greece INGV-UPAT 2010-2011 joint activity G. Papatheodorou, G. Etiope D. Christodoulou, N. Lo Bue, S. Kordella, G. Marinaro, ……put here all names you wish…… 1. Oxygen distribution and gas seepage in Amvrakikos and Aetoliko lagoons Low seepage 2a.Areal surveys along the Katakolo fault (bathymetric, SSS and MEDUSA data) 2b.Monitoring of oxygen and methane changes in a gas seep field by GMM observatory High seepage
HYPOX DoW says… Gas (CH4) seepage • Seepage-related hypoxia • a) oxygen consumption by CH4 oxidation • b) up-welling (driven by density changes) of deep oxygen-poor water into the photic zone and surface layer • A phenomenon widely observed but poorly studied in detail: • - Cariaco Basin (Venezuela): 98% of CH4 is fossil (Kessler et al 2005) • Benguela-Namibia: H2S is from seepage (Emeis et al 2004; Monteiro et al 2006) • Gulf of Mexico: - Hypoxia induced by petroleum leakage (Kessler et al, 2010) • - Study of light hydrocarbons and oxygen depletion associated with oil-gas leaks (University of North Carolina and Aanderaa Data Instruments, AADI)
WHERE AND HOW WP7 Amvrakikos Gulf MEDUSA • Mediterranean fjord (max 65 m) • Anoxia indicated by black muddy sedim., “rotten eggs” smell, catastrophic events (mass mortality of fishes) • Causes: • Stratification of upper water layer • - Gas seepage from seafloor ?? GEOPHYSICAL SURVEYS, CASTS AND WATER-SEDIMENT SAMPLING BY DIVERS Aetoliko Lagoon • Wetland, largest coastal lagoon in Greece • max 32 m; permanent anoxic and • H2S oversaturated (massive death of fishes) • Causes: • - low water circulation • gypsum dissolution (outcropping diapirs) ? • gas seepage (crater-like features) ?? GEOPHYSICAL SURVEYS, CASTS AND WATER-SEDIMENT SAMPLING BY DIVERS GMM Katakolo Bay Harbour max 30 m Vast seepage of thermogenic gas No evidence of hypoxia (open sea) but a natural laboratory to study O2 distribution vs seepage MEDUSA GEOPHYSICAL SURVEYS, CASTS AND WATER-SEDIMENT SAMPLING BY DIVERS
We selected a protected seep site, where we know: -gas flux -gas composition and origin -all oceanographic parameters -meteo data A unique opportunity to study O2 vs gas seepage by a long term monitoring monitoring of O2 in a thermogenic gas seep near-field CH4 O2 ? CH4
GAS MONITORING MODULE (GMM) Autonomous benthic station with Data Acquisition and Control System DESIGN DEPTH: 600 m DIMENSIONS HEIGHT: 1550 mm OVERALL DIAMETER: 1500 mm PAYLOAD 1 ELECTRONICS VESSEL 1 BATTERY VESSEL 2 METHANE SENSORS 1 H2S SENSOR 1 CTD 1 CURRENT METER 1 TURBIDIMETER WEIGHT ……. kN (in air) …… kN (in water) Or a better GMM photo…???
CH4 sensors (METS Franatech) Semiconductor + membrane Range: 0.1-10 mM (pump) 0.01-1mM GMM SENSOR PACKAGE Current meter (………….) O2 sensor (AAnderaa…….) Turbidimeter (……) H2S sensor (AMT) ………mg/L CTD (Seabird……..)
All sensors are managed with the same time reference by a Data Acquisition and Control System System management (e.g., data request, system reconfiguration, restart) Data acquisition from sensors Switch on/off of individual sensors Processing data (quality check, occurrence of events) Monitor internal status parameters and external power supply Back-up of data in internal memory
GMM MONITORING IN KATAKOLO Deployment: 22 September 2010 End monitoring: 31 December 2010 (Recovery: 17 January 2011) 37.644722° 21.319515° fault seepage zone
GMM MONITORING IN KATAKOLO 101 days of continuous acquisition; no reboots CH4 T C P O2 H2S
CH4 variations from 0.018 to 2.4 mM (METS G70 with pump) no drifts in sensor signals; lower values for T41 T41 G70 G70+pump T41
METS G70 with pump vs T41 no pump Good correlation between the two sensors (hysteresis on T41, membrane not washed by pump) T41 G70 T41 G70+pump We’ll use G70+pump for comparison with O2
O2 decreasing periods (8 main events) 24Dec 23-24Sep 31Oct 19-21 Nov 21-22Oct 1-3Oct 8-11Dec 16Nov wide O2 variations from 265 to 13 mM hypoxia
23-24 Sept Mobile average 1h O2 depletion (~80 mM) CH4 increase (0.2-0.5 mM) O2 DOx/DMe = 160-400 CH4 1-3 Oct Mobile average 1h O2 depletion (~150 mM) CH4 increase (0.4-0.6 mM) DOx/DMe = 250-375
21-22 Oct Mobile average 1h O2 depletion (~80 mM) CH4 increase (0.25 mM) DOx/DMe = 320 Mobile average 1h 31 Oct O2 depletion (~160 mM) CH4 increase (0.6 mM) O2 DOx/DMe = 270 CH4
Mobile average 1h 16 Nov O2 depletion (~100 mM) CH4 increase (0.3 mM) O2 DOx/DMe = 300 CH4 Mobile average 1h 19-21 Nov O2 depletion (~150 mM) CH4 increase (0.4 mM) O2 DOx/DMe = 375 CH4
8-11 Dec Mobile average 1h O2 depletion (~140 mM) CH4 increase (0.4 mM) DOx/DMe = 350 24 Dec Mobile average 1h O2 depletion (~200 mM) CH4 increase (0.8 mM) O2 DOx/DMe = 250 CH4
O2 depletion seems to be proportional to CH4 increases (a larger number of cases need to be examined) DO2 DCH4
Short term variations of T and O2 related to seepage were identified in previous benthic observatory monitoring at higher depths (GMM in Patras pockmark 44m, SN-4 Marmara Sea Anatolian fault 170 m). Typical patterns = CH4 increase with T and O2 decreases (or drops) Marinaro et al. (in preparation) “Marmara-ESONET project”
For GMM Katakolo data a first series of CH4peaks/T-Pdrops were identified (a complete analysis has still to be done) P T 28 Dec 28 Dec CH4 (no-pump) CH4 (pump) CH4 increase 15-20 min before T and P drops (no O2 variations)
For GMM Katakolo data a first series of CH4peaks/T-Pdrops were identified (a complete analysis has still to be done) 16 Dec CH4 T
Inverse CH4 vs O2 at 1h time scale (short-term seepage effect?) 14 Oct CH4 O2 12 Oct O2 CH4
Current meter? Turbidimeter? Meteo data?????
PRELIMINARY CONCLUSIONS - GMM successfully performed a long-term (101 days) monitoring of oxygen in a methane seepage site (bubble plume near-field) - Data interpretation (relationships among all parameters) needs a detailed intercomparison at different time scales (minutes, hours, days), as different processes (seepage, currents, meteo) operates at different time scales - Strong O2 variations (DO2 up to 200 mM) - Preliminary analysis shows periods of O2 decrease (hours) associated to enhanced CH4 events. - Short term events of T and P drops are associated to CH4 peaks (as observed in other seepage sites) Current? Turbidimeter? Meteo data? Katakolo monitoring site (-7.5 m) seems to be highly perturbed by atmospheric variations (wind, waves and meteo conditions) Higher “noise” and additional factors driving T and O2. (rapid O2 decreases also may induce biases in CH4 sensors = false increase)
PRELIMINARY CONCLUSIONS • O2 depletion likely related to oxidation (microbial + light?) of CH4 and very likely C2H6 + C3H8 • Katakolo gas (thermogenic, C1: 84%, C2: 1.45%, C3: 0.15%) has a strong O2 oxidation potential • Quantitative evaluations shall be based on accurate gas and microbial analyses • In the GoM Deep Water Horizon oil spill propane and ethane were the primary drivers of microbial respiration, accounting for up to 70% of the observed oxygen depletion (Valentine et al 2010).
on days time scale: CH4 peaks associated to O2 peaks!!!! (is the O2 correction too strong to completely determine the CH4 pattern?) O2 CH4 CH4 -corr
Comparison with O2 vs hydrocarbons in the GoM Deep Water Horizon oil spill (Valentine et al 2010) “Propane and ethane were the primary drivers of microbial respiration, accounting for up to 70% of the observed oxygen depletion in fresh plume” 10 mM CH4 +C2+C3 = 30 mM O2
Comparison with CH4 in other seepage areas (Valentine et al 2010) Hikurangi Margin, New Zealand Krabbenhoeft et al (2009)