1 / 2

Gas Mixing Analysis: Thermodynamic Expansions Visualization

Illustration of the mixing of two gases as expansions, showing changes in microstates, entropy, enthalpy, and Gibbs free energy. Graph depicts functions of x1 for ideal gas mixing.

axl
Download Presentation

Gas Mixing Analysis: Thermodynamic Expansions Visualization

An Image/Link below is provided (as is) to download presentation Download Policy: Content on the Website is provided to you AS IS for your information and personal use and may not be sold / licensed / shared on other websites without getting consent from its author. Content is provided to you AS IS for your information and personal use only. Download presentation by click this link. While downloading, if for some reason you are not able to download a presentation, the publisher may have deleted the file from their server. During download, if you can't get a presentation, the file might be deleted by the publisher.

E N D

Presentation Transcript


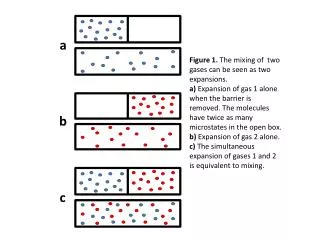
  1. a Figure 1. The mixing of two gases can be seen as two expansions. a) Expansion of gas 1 alone when the barrier is removed. The molecules have twice as many microstates in the open box. b) Expansion of gas 2 alone. c) The simultaneous expansion of gases 1 and 2 is equivalent to mixing. b c

  2. TΔmixS ΔmixH 0 Joules ΔmixG 0.0 0.2 0.4 0.6 0.8 1.0 x1 Figure 2. A graph of TΔmixS, ΔmixH, and ΔmixG as functions of x1 for the mixing of two ideal gases.

More Related