Weekly Technical Report :27 August 2018
10 likes | 36 Views
Axis Direct presents daily derivatives report presenting recommendations based on technical analysis. For trading in derivatives visit https://simplehai.axisdirect.in/offerings/products/derivatives<br>https://simplehai.axisdirect.in/share-stock-prices/nse/Just-Dial-Ltd-41369

Weekly Technical Report :27 August 2018
E N D
Presentation Transcript
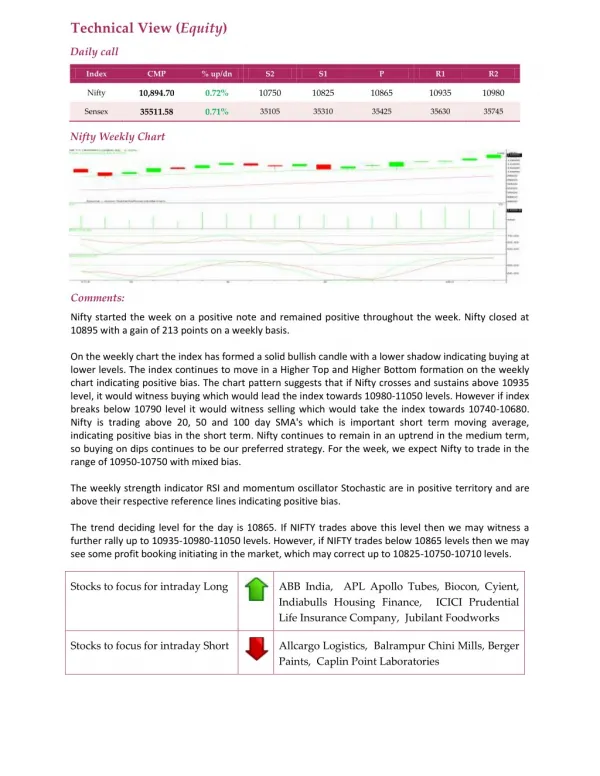
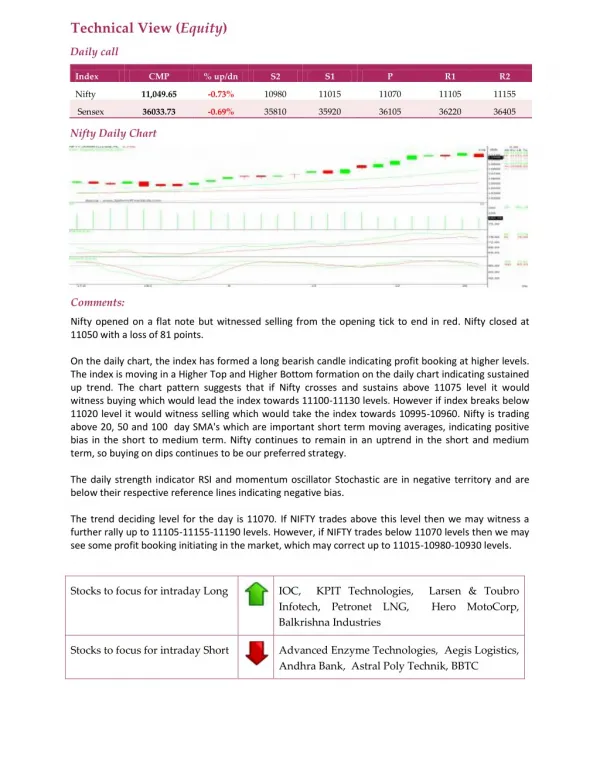
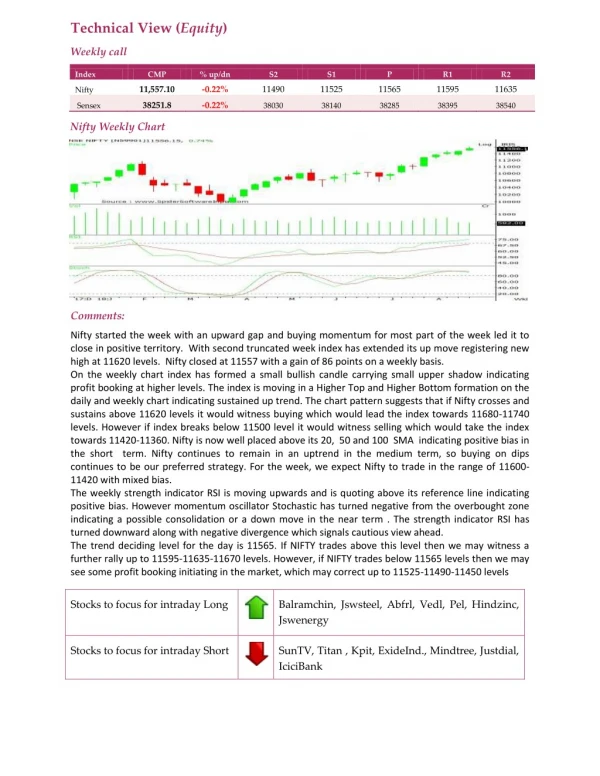
Technical View (Equity) Weekly call Index CMP % up/dn S2 S1 P R1 R2 11,557.10 -0.22% 11490 11525 11565 11595 11635 Nifty 38251.8 -0.22% Sensex 38030 38140 38285 38395 38540 Nifty Weekly Chart Comments: Nifty started the week with an upward gap and buying momentum for most part of the week led it to close in positive territory. With second truncated week index has extended its up move registering new high at 11620 levels. Nifty closed at 11557 with a gain of 86 points on a weekly basis. On the weekly chart index has formed a small bullish candle carrying small upper shadow indicating profit booking at higher levels. The index is moving in a Higher Top and Higher Bottom formation on the daily and weekly chart indicating sustained up trend. The chart pattern suggests that if Nifty crosses and sustains above 11620 levels it would witness buying which would lead the index towards 11680-11740 levels. However if index breaks below 11500 level it would witness selling which would take the index towards 11420-11360. Nifty is now well placed above its 20, 50 and 100 SMA indicating positive bias in the short term. Nifty continues to remain in an uptrend in the medium term, so buying on dips continues to be our preferred strategy. For the week, we expect Nifty to trade in the range of 11600- 11420 with mixed bias. The weekly strength indicator RSI is moving upwards and is quoting above its reference line indicating positive bias. However momentum oscillator Stochastic has turned negative from the overbought zone indicating a possible consolidation or a down move in the near term . The strength indicator RSI has turned downward along with negative divergence which signals cautious view ahead. The trend deciding level for the day is 11565. If NIFTY trades above this level then we may witness a further rally up to 11595-11635-11670 levels. However, if NIFTY trades below 11565 levels then we may see some profit booking initiating in the market, which may correct up to 11525-11490-11450 levels Stocks to focus for intraday Long Balramchin, Jswsteel, Abfrl, Vedl, Pel, Hindzinc, Jswenergy Stocks to focus for intraday Short SunTV, Titan , Kpit, ExideInd., Mindtree, Justdial, IciciBank