Download
1 / 1
10 likes | 40 Views
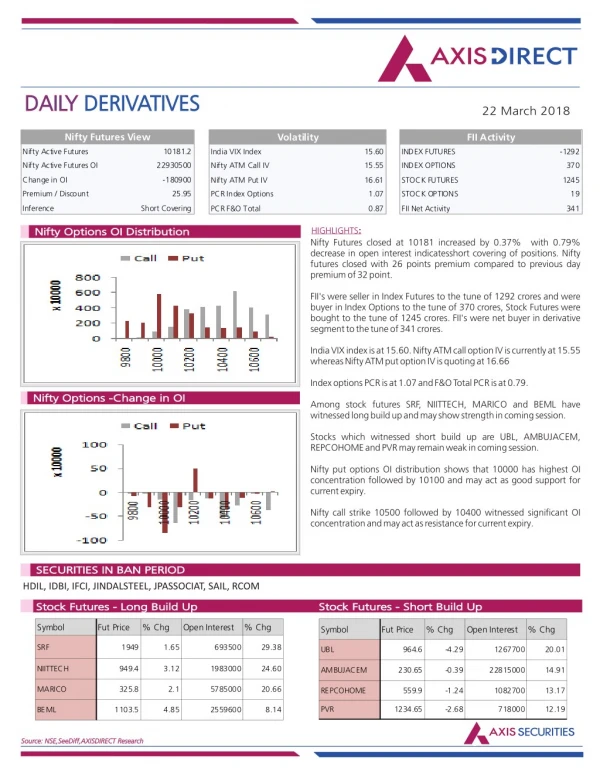
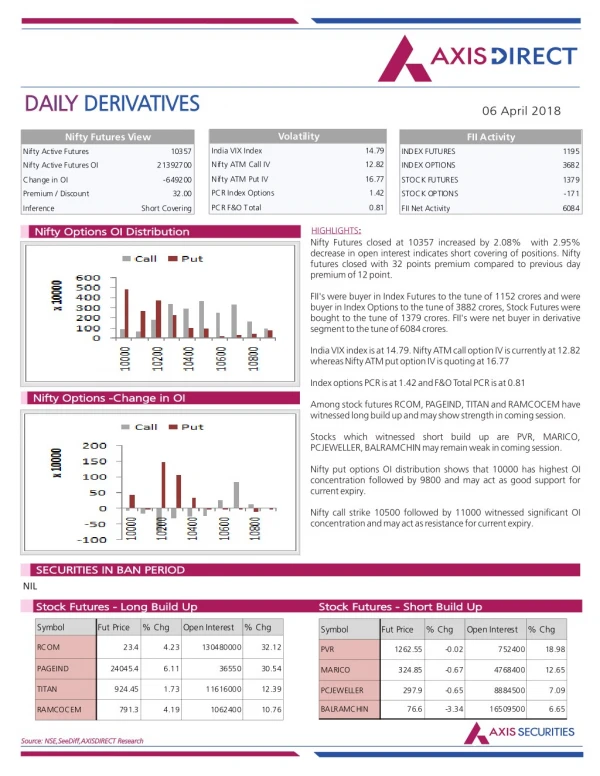
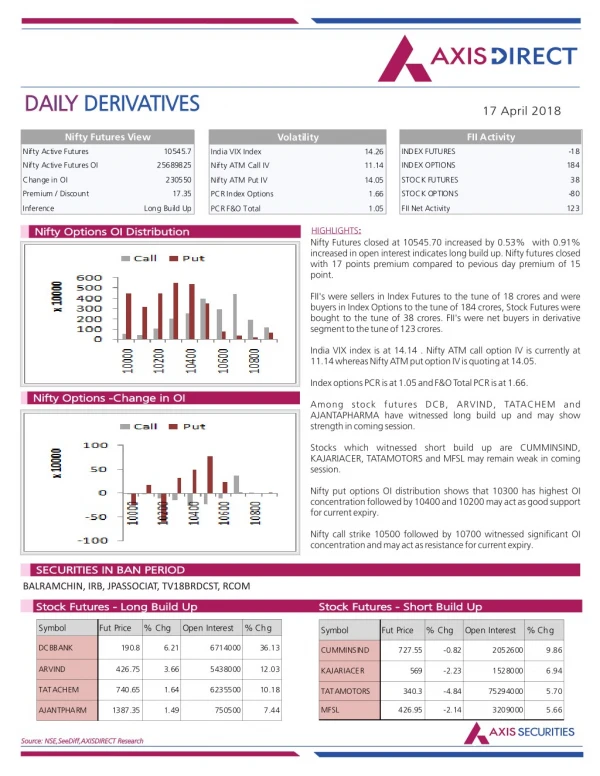
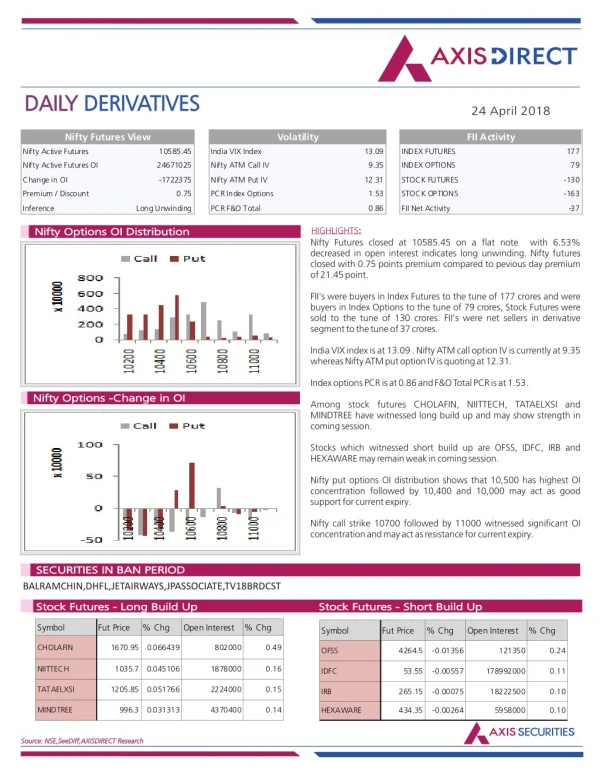
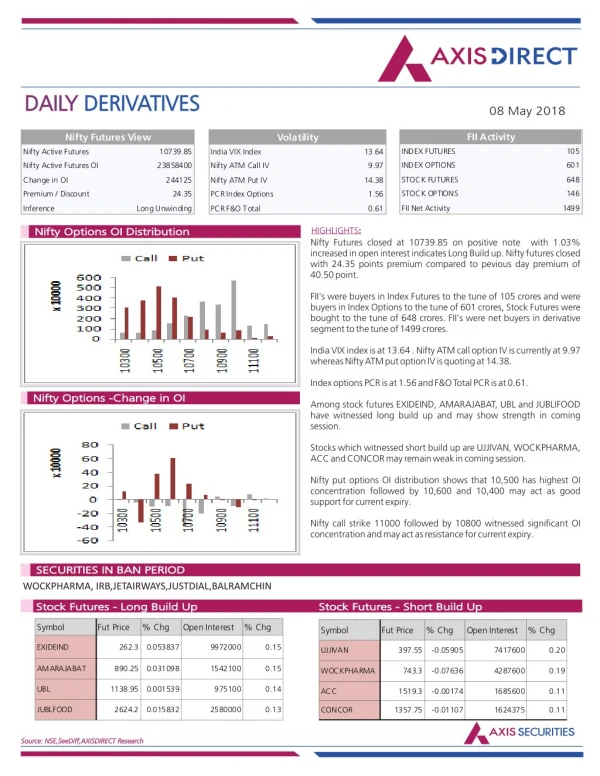
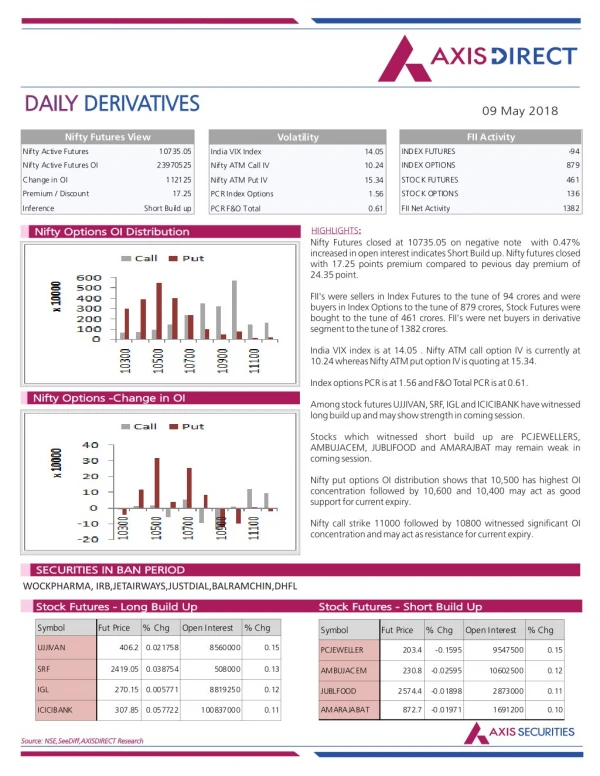
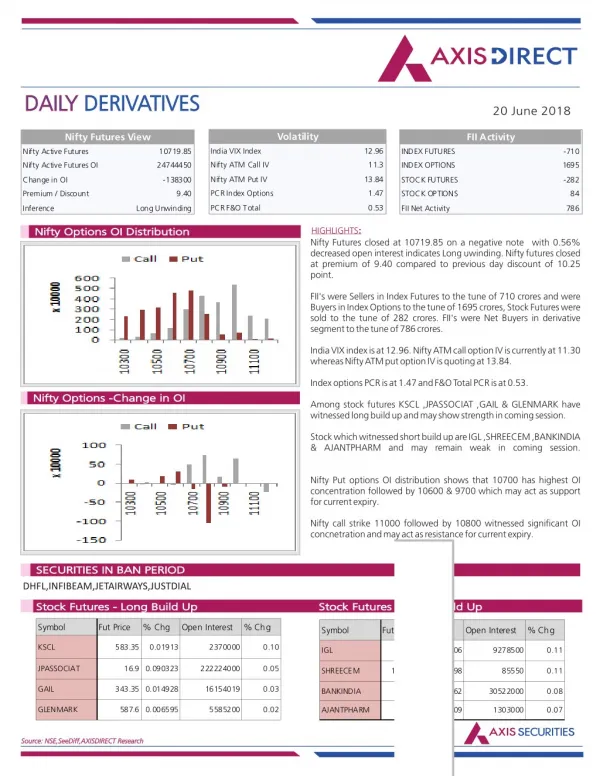
Axis Direct presents daily derivatives report presenting recommendations based on technical analysis. For trading in derivatives visit https://simplehai.axisdirect.in/offerings/products/derivatives

E N D
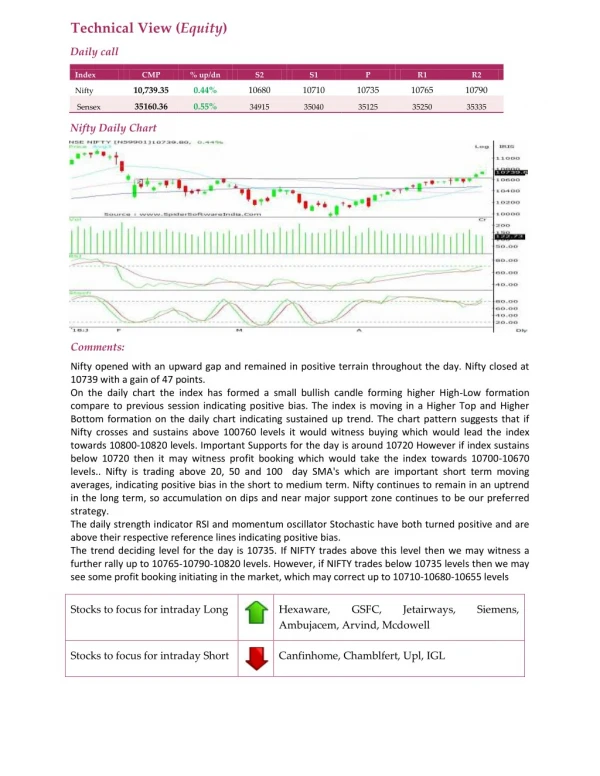
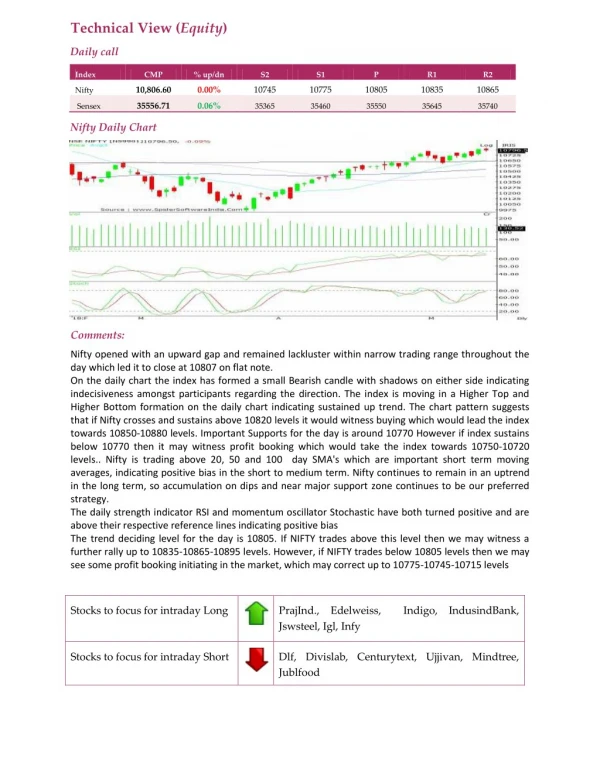
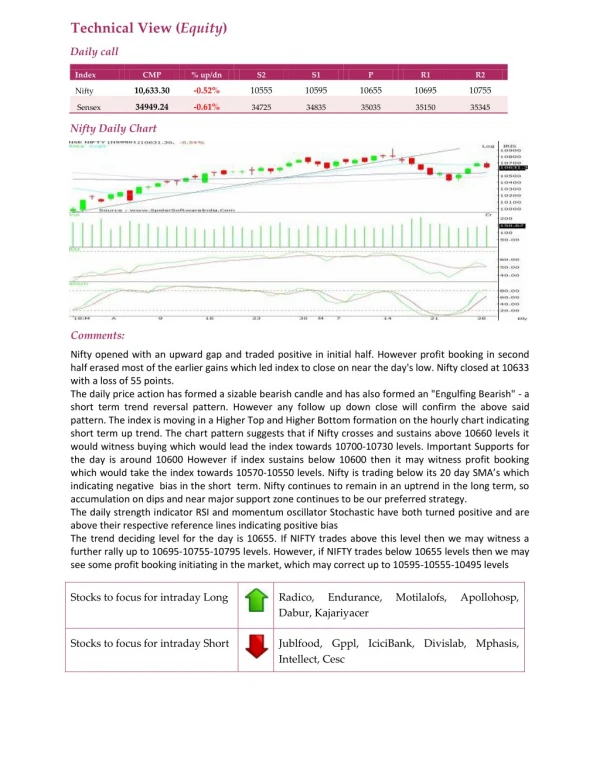
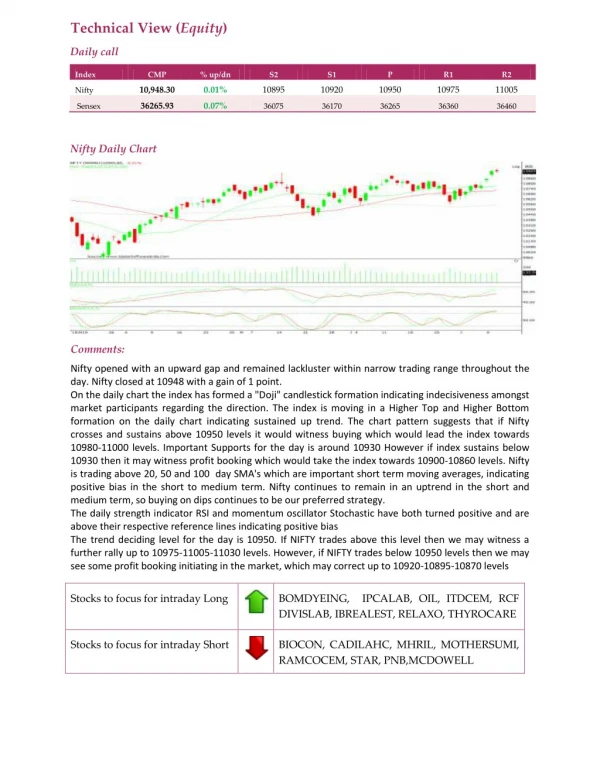
Technical View (Equity) Daily call Index CMP % up/dn S2 S1 P R1 R2 10,948.30 0.01% 10895 10920 10950 10975 11005 Nifty 36265.93 0.07% Sensex 36075 36170 36265 36360 36460 Nifty Daily Chart Comments: Nifty opened with an upward gap and remained lackluster within narrow trading range throughout the day. Nifty closed at 10948 with a gain of 1 point. On the daily chart the index has formed a "Doji" candlestick formation indicating indecisiveness amongst market participants regarding the direction. The index is moving in a Higher Top and Higher Bottom formation on the daily chart indicating sustained up trend. The chart pattern suggests that if Nifty crosses and sustains above 10950 levels it would witness buying which would lead the index towards 10980-11000 levels. Important Supports for the day is around 10930 However if index sustains below 10930 then it may witness profit booking which would take the index towards 10900-10860 levels. Nifty is trading above 20, 50 and 100 day SMA's which are important short term moving averages, indicating positive bias in the short to medium term. Nifty continues to remain in an uptrend in the short and medium term, so buying on dips continues to be our preferred strategy. The daily strength indicator RSI and momentum oscillator Stochastic have both turned positive and are above their respective reference lines indicating positive bias The trend deciding level for the day is 10950. If NIFTY trades above this level then we may witness a further rally up to 10975-11005-11030 levels. However, if NIFTY trades below 10950 levels then we may see some profit booking initiating in the market, which may correct up to 10920-10895-10870 levels Stocks to focus for intraday Long BOMDYEING, IPCALAB, OIL, ITDCEM, RCF DIVISLAB, IBREALEST, RELAXO, THYROCARE Stocks to focus for intraday Short BIOCON, CADILAHC, MHRIL, MOTHERSUMI, RAMCOCEM, STAR, PNB,MCDOWELL