Download
1 / 1
10 likes | 26 Views
Axis Direct presents daily derivatives report presenting recommendations based on technical analysis. For trading in derivatives visit https://simplehai.axisdirect.in/offerings/products/derivatives<br>https://simplehai.axisdirect.in/share-stock-prices/nse/Coal-India-Ltd-12019<br>https://simplehai.axisdirect.in/share-stock-prices/nse/ICICI-Bank-Ltd-5418

E N D
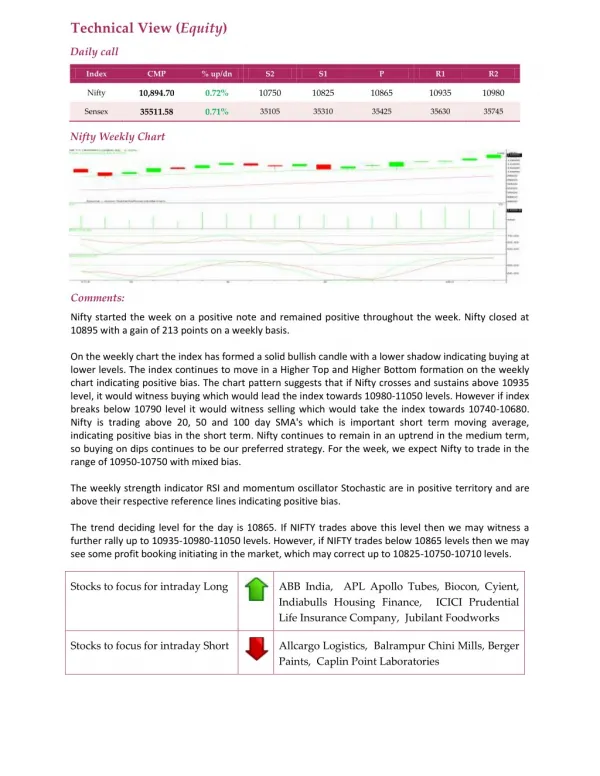
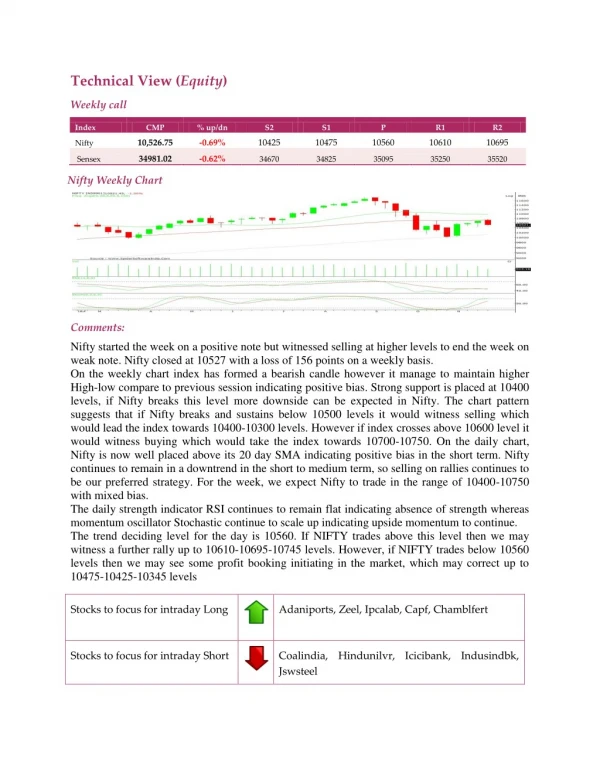
Technical View (Equity) Weekly call Index CMP % up/dn S2 S1 P R1 R2 10,526.75 -0.69% 10425 10475 10560 10610 10695 Nifty 34981.02 -0.62% Sensex 34670 34825 35095 35250 35520 Nifty Weekly Chart Comments: Nifty started the week on a positive note but witnessed selling at higher levels to end the week on weak note. Nifty closed at 10527 with a loss of 156 points on a weekly basis. On the weekly chart index has formed a bearish candle however it manage to maintain higher High-low compare to previous session indicating positive bias. Strong support is placed at 10400 levels, if Nifty breaks this level more downside can be expected in Nifty. The chart pattern suggests that if Nifty breaks and sustains below 10500 levels it would witness selling which would lead the index towards 10400-10300 levels. However if index crosses above 10600 level it would witness buying which would take the index towards 10700-10750. On the daily chart, Nifty is now well placed above its 20 day SMA indicating positive bias in the short term. Nifty continues to remain in a downtrend in the short to medium term, so selling on rallies continues to be our preferred strategy. For the week, we expect Nifty to trade in the range of 10400-10750 with mixed bias. The daily strength indicator RSI continues to remain flat indicating absence of strength whereas momentum oscillator Stochastic continue to scale up indicating upside momentum to continue. The trend deciding level for the day is 10560. If NIFTY trades above this level then we may witness a further rally up to 10610-10695-10745 levels. However, if NIFTY trades below 10560 levels then we may see some profit booking initiating in the market, which may correct up to 10475-10425-10345 levels Stocks to focus for intraday Long Adaniports, Zeel, Ipcalab, Capf, Chamblfert Stocks to focus for intraday Short Coalindia, Hindunilvr, Icicibank, Indusindbk, Jswsteel