Download
1 / 1
10 likes | 27 Views
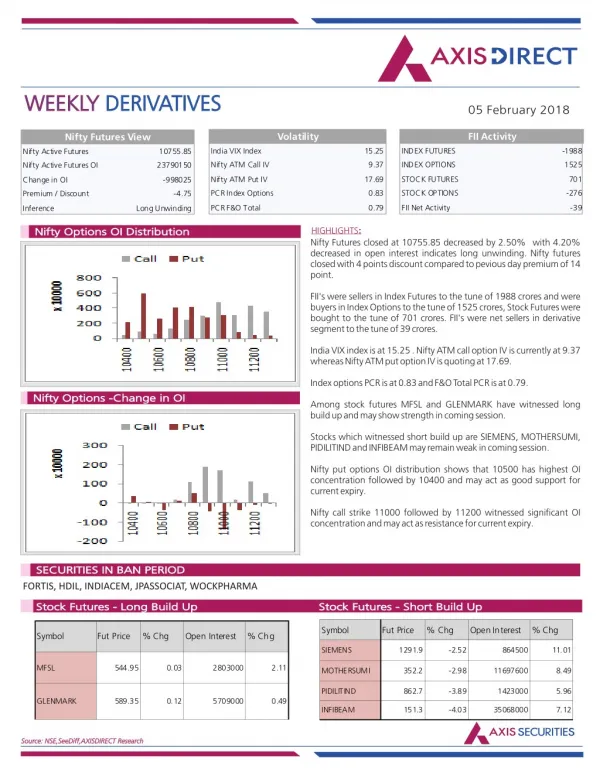
Axis Direct presents daily derivatives report presenting recommendations based on technical analysis. For trading in derivatives visit https://simplehai.axisdirect.in/offerings/products/derivatives<br>https://simplehai.axisdirect.in/share-stock-prices/nse/CEAT-Ltd-104<br>https://simplehai.axisdirect.in/share-stock-prices/nse/Adani-Ports-&-Special-Economic-Zone-Ltd-21281<br>https://simplehai.axisdirect.in/share-stock-prices/nse/Infosys-Ltd-2806<br>

E N D
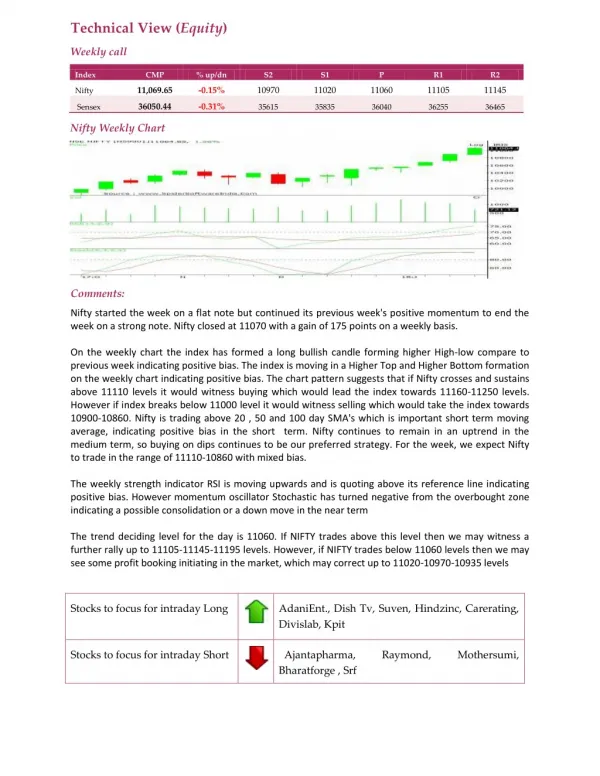
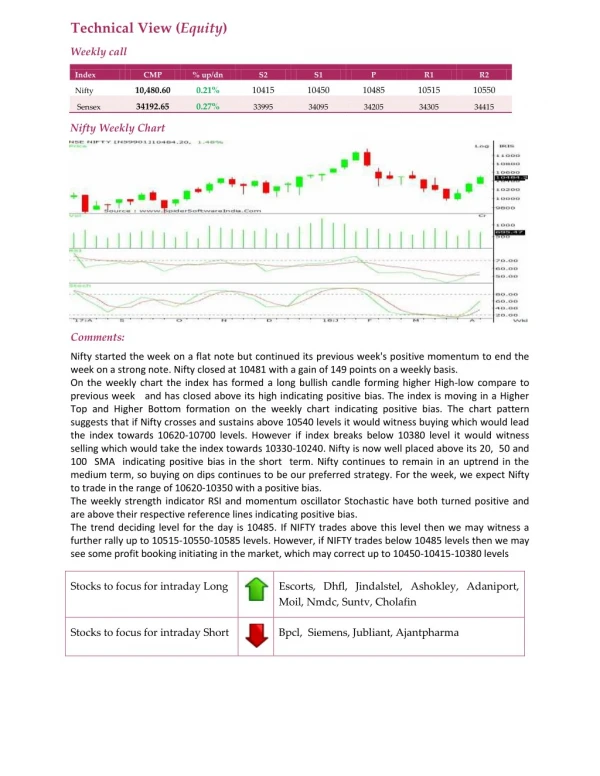
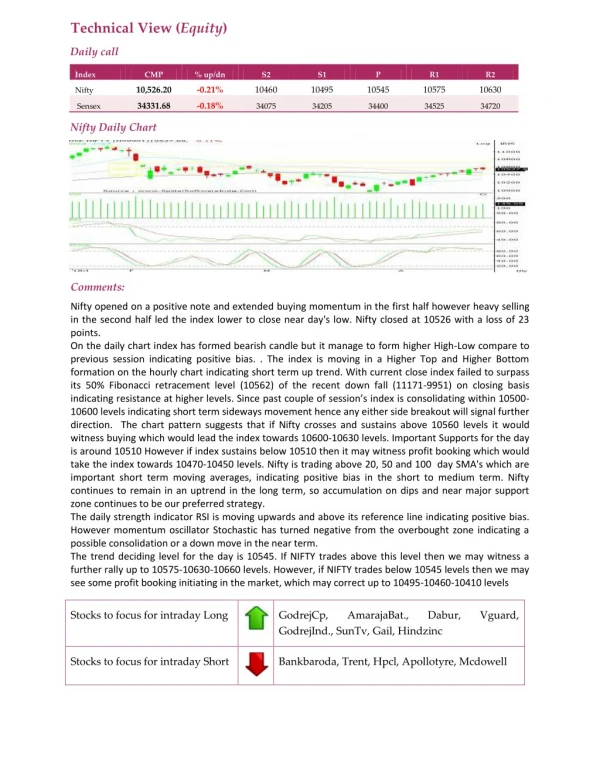
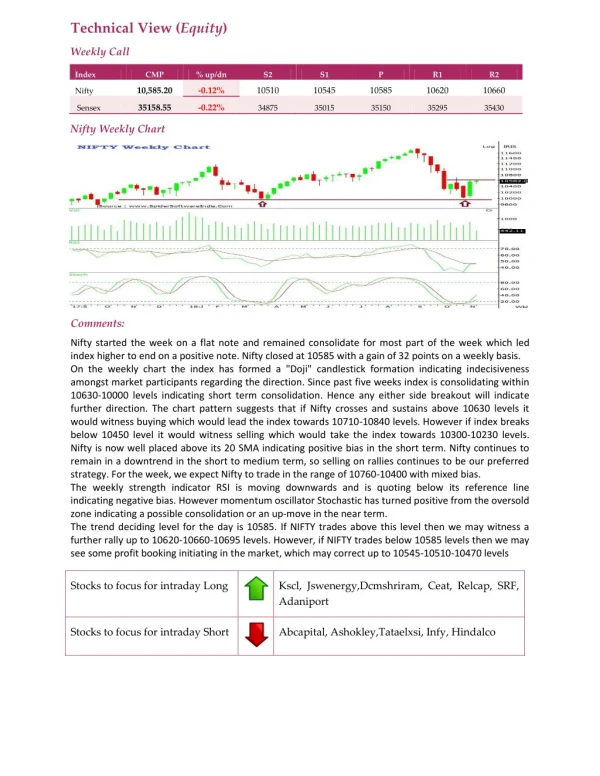
Technical View (Equity) Weekly Call Index CMP % up/dn S2 S1 P R1 R2 10,585.20 -0.12% 10510 10545 10585 10620 10660 Nifty 35158.55 -0.22% Sensex 34875 35015 35150 35295 35430 Nifty Weekly Chart Comments: Nifty started the week on a flat note and remained consolidate for most part of the week which led index higher to end on a positive note. Nifty closed at 10585 with a gain of 32 points on a weekly basis. On the weekly chart the index has formed a "Doji" candlestick formation indicating indecisiveness amongst market participants regarding the direction. Since past five weeks index is consolidating within 10630-10000 levels indicating short term consolidation. Hence any either side breakout will indicate further direction. The chart pattern suggests that if Nifty crosses and sustains above 10630 levels it would witness buying which would lead the index towards 10710-10840 levels. However if index breaks below 10450 level it would witness selling which would take the index towards 10300-10230 levels. Nifty is now well placed above its 20 SMA indicating positive bias in the short term. Nifty continues to remain in a downtrend in the short to medium term, so selling on rallies continues to be our preferred strategy. For the week, we expect Nifty to trade in the range of 10760-10400 with mixed bias. The weekly strength indicator RSI is moving downwards and is quoting below its reference line indicating negative bias. However momentum oscillator Stochastic has turned positive from the oversold zone indicating a possible consolidation or an up-move in the near term. The trend deciding level for the day is 10585. If NIFTY trades above this level then we may witness a further rally up to 10620-10660-10695 levels. However, if NIFTY trades below 10585 levels then we may see some profit booking initiating in the market, which may correct up to 10545-10510-10470 levels Stocks to focus for intraday Long Kscl, Jswenergy,Dcmshriram, Ceat, Relcap, SRF, Adaniport Stocks to focus for intraday Short Abcapital, Ashokley,Tataelxsi, Infy, Hindalco