Download
1 / 1
10 likes | 37 Views
Axis Direct presents daily derivatives report presenting recommendations based on technical analysis. For trading in derivatives visit https://simplehai.axisdirect.in/offerings/products/derivatives<br>https://simplehai.axisdirect.in/share-stock-prices/nse/Adani-Ports-&-Special-Economic-Zone-Ltd-21281<br>

E N D
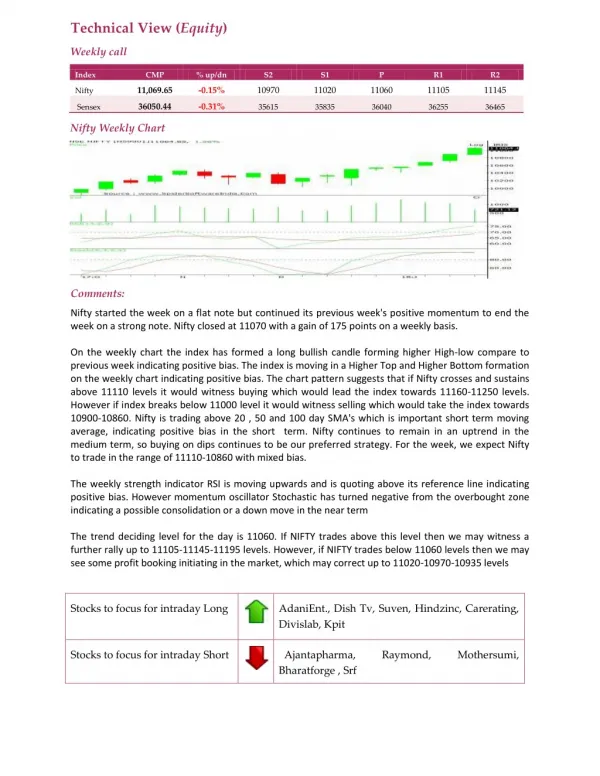
Technical View (Equity) Weekly call Index CMP % up/dn S2 S1 P R1 R2 11,069.65 -0.15% 10970 11020 11060 11105 11145 Nifty 36050.44 -0.31% Sensex 35615 35835 36040 36255 36465 Nifty Weekly Chart Comments: Nifty started the week on a flat note but continued its previous week's positive momentum to end the week on a strong note. Nifty closed at 11070 with a gain of 175 points on a weekly basis. On the weekly chart the index has formed a long bullish candle forming higher High-low compare to previous week indicating positive bias. The index is moving in a Higher Top and Higher Bottom formation on the weekly chart indicating positive bias. The chart pattern suggests that if Nifty crosses and sustains above 11110 levels it would witness buying which would lead the index towards 11160-11250 levels. However if index breaks below 11000 level it would witness selling which would take the index towards 10900-10860. Nifty is trading above 20 , 50 and 100 day SMA's which is important short term moving average, indicating positive bias in the short term. Nifty continues to remain in an uptrend in the medium term, so buying on dips continues to be our preferred strategy. For the week, we expect Nifty to trade in the range of 11110-10860 with mixed bias. The weekly strength indicator RSI is moving upwards and is quoting above its reference line indicating positive bias. However momentum oscillator Stochastic has turned negative from the overbought zone indicating a possible consolidation or a down move in the near term The trend deciding level for the day is 11060. If NIFTY trades above this level then we may witness a further rally up to 11105-11145-11195 levels. However, if NIFTY trades below 11060 levels then we may see some profit booking initiating in the market, which may correct up to 11020-10970-10935 levels Stocks to focus for intraday Long AdaniEnt., Dish Tv, Suven, Hindzinc, Carerating, Divislab, Kpit Stocks to focus for intraday Short Ajantapharma, Bharatforge , Srf Raymond, Mothersumi,