Download
1 / 1
10 likes | 50 Views
Axis Direct presents daily derivatives report presenting recommendations based on technical analysis. For trading in derivatives visit https://simplehai.axisdirect.in/offerings/products/derivatives<br>https://simplehai.axisdirect.in/share-stock-prices/nse/Tech-Mahindra-Ltd-17215<br>

E N D
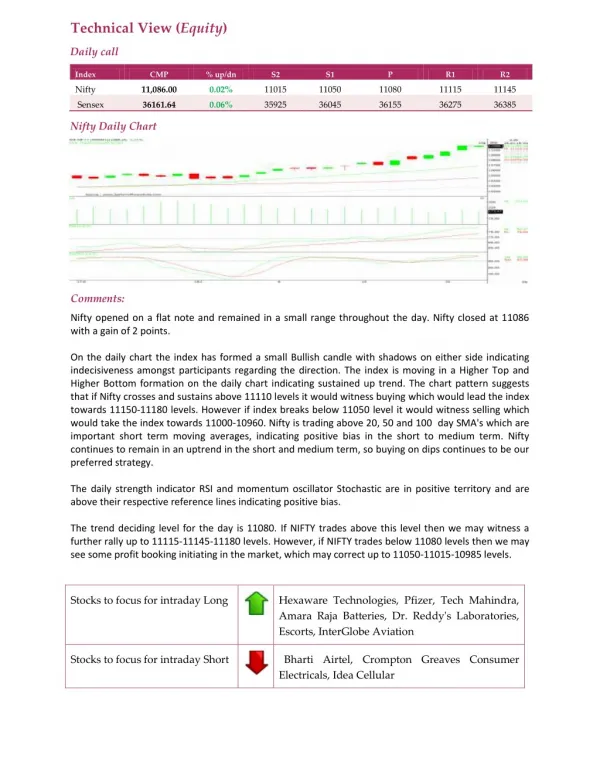
Technical View (Equity) Daily call Index CMP % up/dn S2 S1 P R1 R2 Nifty 11,086.00 0.02% 11015 11050 11080 11115 11145 Sensex 36161.64 0.06% 35925 36045 36155 36275 36385 Nifty Daily Chart Comments: Nifty opened on a flat note and remained in a small range throughout the day. Nifty closed at 11086 with a gain of 2 points. On the daily chart the index has formed a small Bullish candle with shadows on either side indicating indecisiveness amongst participants regarding the direction. The index is moving in a Higher Top and Higher Bottom formation on the daily chart indicating sustained up trend. The chart pattern suggests that if Nifty crosses and sustains above 11110 levels it would witness buying which would lead the index towards 11150-11180 levels. However if index breaks below 11050 level it would witness selling which would take the index towards 11000-10960. Nifty is trading above 20, 50 and 100 day SMA's which are important short term moving averages, indicating positive bias in the short to medium term. Nifty continues to remain in an uptrend in the short and medium term, so buying on dips continues to be our preferred strategy. The daily strength indicator RSI and momentum oscillator Stochastic are in positive territory and are above their respective reference lines indicating positive bias. The trend deciding level for the day is 11080. If NIFTY trades above this level then we may witness a further rally up to 11115-11145-11180 levels. However, if NIFTY trades below 11080 levels then we may see some profit booking initiating in the market, which may correct up to 11050-11015-10985 levels. Stocks to focus for intraday Long Hexaware Technologies, Pfizer, Tech Mahindra, Amara Raja Batteries, Dr. Reddy's Laboratories, Escorts, InterGlobe Aviation Stocks to focus for intraday Short Bharti Airtel, Crompton Greaves Consumer Electricals, Idea Cellular