Download
1 / 1
10 likes | 33 Views
Axis Direct presents daily derivatives report presenting recommendations based on technical analysis. For trading in derivatives visit https://simplehai.axisdirect.in/offerings/products/derivatives<br>https://simplehai.axisdirect.in/share-stock-prices/nse/Ashok-Leyland-Ltd-31<br>

E N D
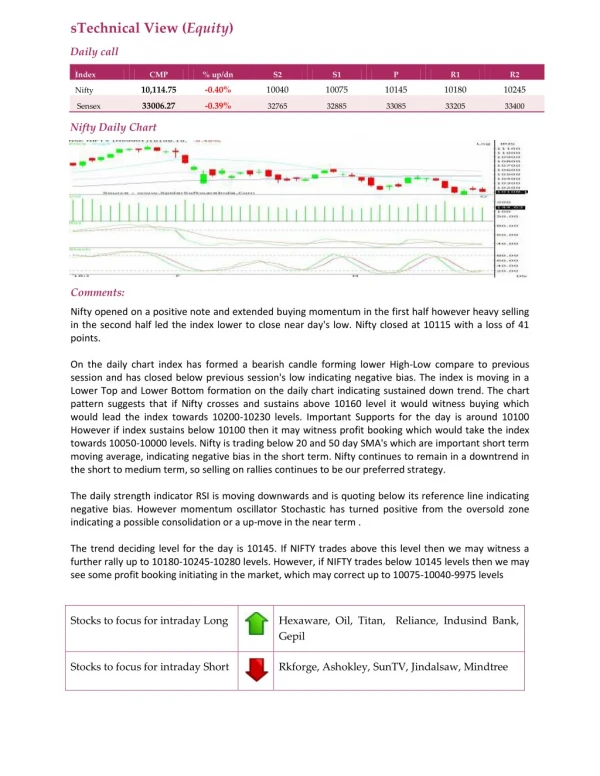
sTechnical View (Equity) Daily call Index CMP % up/dn S2 S1 P R1 R2 10,114.75 -0.40% 10040 10075 10145 10180 10245 Nifty 33006.27 -0.39% Sensex 32765 32885 33085 33205 33400 Nifty Daily Chart Comments: Nifty opened on a positive note and extended buying momentum in the first half however heavy selling in the second half led the index lower to close near day's low. Nifty closed at 10115 with a loss of 41 points. On the daily chart index has formed a bearish candle forming lower High-Low compare to previous session and has closed below previous session's low indicating negative bias. The index is moving in a Lower Top and Lower Bottom formation on the daily chart indicating sustained down trend. The chart pattern suggests that if Nifty crosses and sustains above 10160 level it would witness buying which would lead the index towards 10200-10230 levels. Important Supports for the day is around 10100 However if index sustains below 10100 then it may witness profit booking which would take the index towards 10050-10000 levels. Nifty is trading below 20 and 50 day SMA's which are important short term moving average, indicating negative bias in the short term. Nifty continues to remain in a downtrend in the short to medium term, so selling on rallies continues to be our preferred strategy. The daily strength indicator RSI is moving downwards and is quoting below its reference line indicating negative bias. However momentum oscillator Stochastic has turned positive from the oversold zone indicating a possible consolidation or a up-move in the near term . The trend deciding level for the day is 10145. If NIFTY trades above this level then we may witness a further rally up to 10180-10245-10280 levels. However, if NIFTY trades below 10145 levels then we may see some profit booking initiating in the market, which may correct up to 10075-10040-9975 levels Stocks to focus for intraday Long Hexaware, Oil, Titan, Reliance, Indusind Bank, Gepil Stocks to focus for intraday Short Rkforge, Ashokley, SunTV, Jindalsaw, Mindtree