1 / 1
10 likes | 50 Views
Axis Direct presents daily derivatives report presenting recommendations based on technical analysis. For trading in derivatives visit https://simplehai.axisdirect.in/offerings/products/derivatives<br>https://simplehai.axisdirect.in/share-stock-prices/nse/Gati-Ltd-14222<br>

E N D
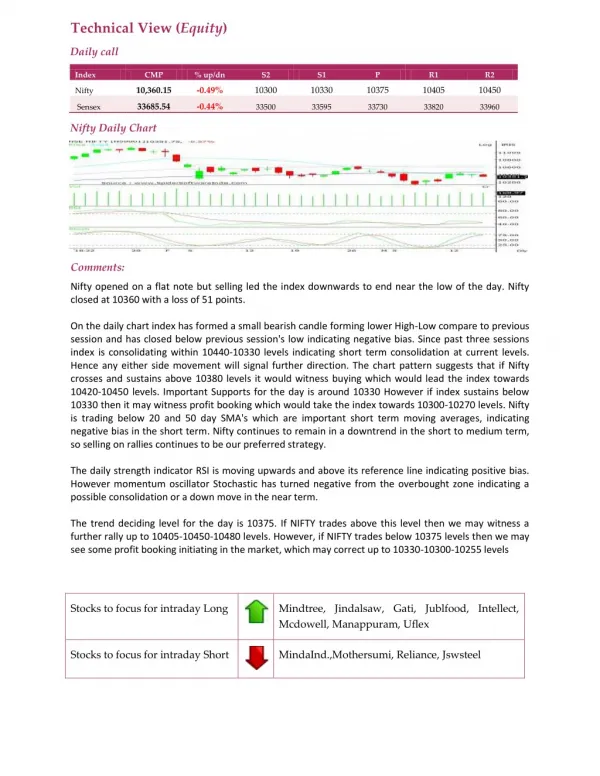
Technical View (Equity) Daily call Index CMP % up/dn S2 S1 P R1 R2 10,360.15 -0.49% 10300 10330 10375 10405 10450 Nifty 33685.54 -0.44% Sensex 33500 33595 33730 33820 33960 Nifty Daily Chart Comments: Nifty opened on a flat note but selling led the index downwards to end near the low of the day. Nifty closed at 10360 with a loss of 51 points. On the daily chart index has formed a small bearish candle forming lower High-Low compare to previous session and has closed below previous session's low indicating negative bias. Since past three sessions index is consolidating within 10440-10330 levels indicating short term consolidation at current levels. Hence any either side movement will signal further direction. The chart pattern suggests that if Nifty crosses and sustains above 10380 levels it would witness buying which would lead the index towards 10420-10450 levels. Important Supports for the day is around 10330 However if index sustains below 10330 then it may witness profit booking which would take the index towards 10300-10270 levels. Nifty is trading below 20 and 50 day SMA's which are important short term moving averages, indicating negative bias in the short term. Nifty continues to remain in a downtrend in the short to medium term, so selling on rallies continues to be our preferred strategy. The daily strength indicator RSI is moving upwards and above its reference line indicating positive bias. However momentum oscillator Stochastic has turned negative from the overbought zone indicating a possible consolidation or a down move in the near term. The trend deciding level for the day is 10375. If NIFTY trades above this level then we may witness a further rally up to 10405-10450-10480 levels. However, if NIFTY trades below 10375 levels then we may see some profit booking initiating in the market, which may correct up to 10330-10300-10255 levels Stocks to focus for intraday Long Mindtree, Jindalsaw, Gati, Jublfood, Intellect, Mcdowell, Manappuram, Uflex Stocks to focus for intraday Short MindaInd.,Mothersumi, Reliance, Jswsteel