Download
1 / 1
10 likes | 37 Views
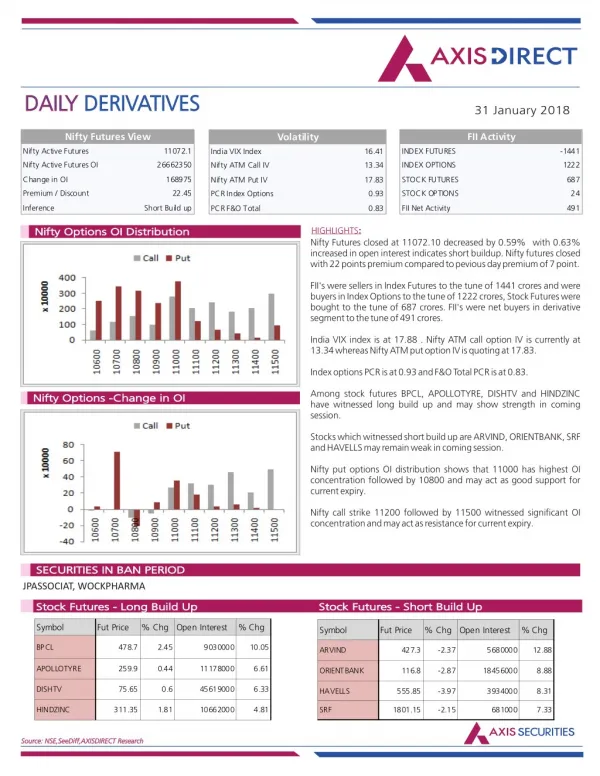
Axis Direct presents daily derivatives report presenting recommendations based on technical analysis. For trading in derivatives visit https://simplehai.axisdirect.in/offerings/products/derivatives<br>https://simplehai.axisdirect.in/share-stock-prices/nse/Tata-Steel-Ltd-566<br>https://simplehai.axisdirect.in/share-stock-prices/nse/Bharat-Petroleum-Corporation-Ltd-2290<br>https://simplehai.axisdirect.in/share-stock-prices/nse/Cipla-Ltd-114<br>https://simplehai.axisdirect.in/share-stock-prices/nse/Coal-India-Ltd-12019<br>

E N D
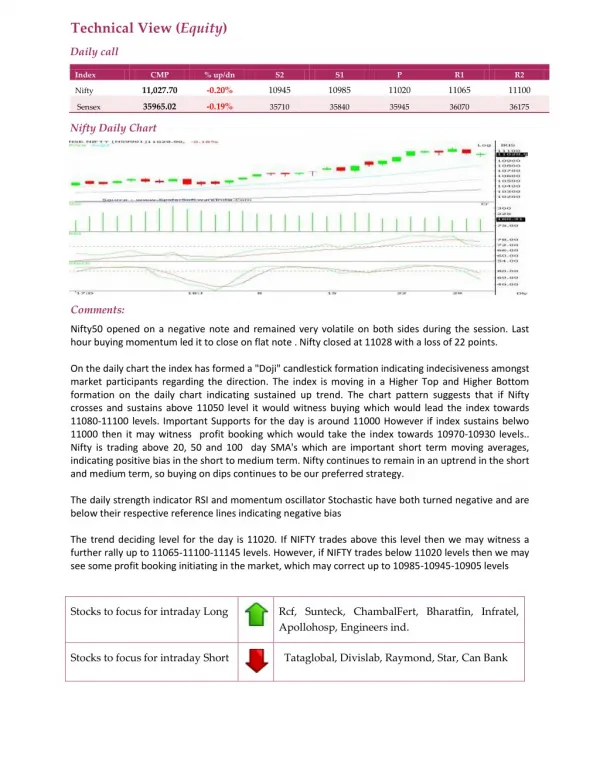
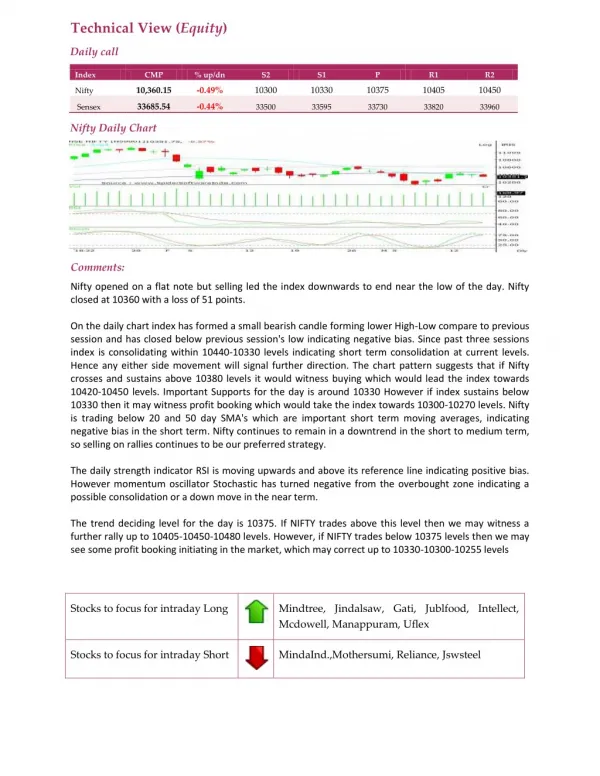
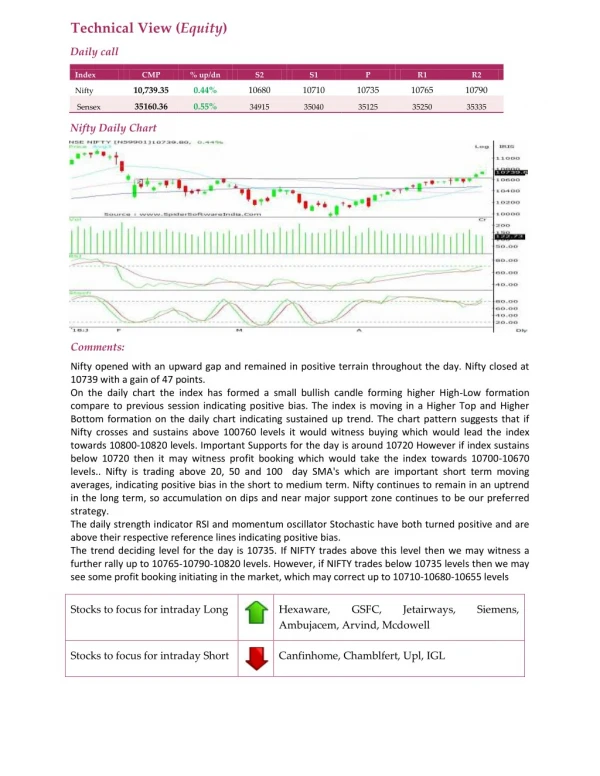
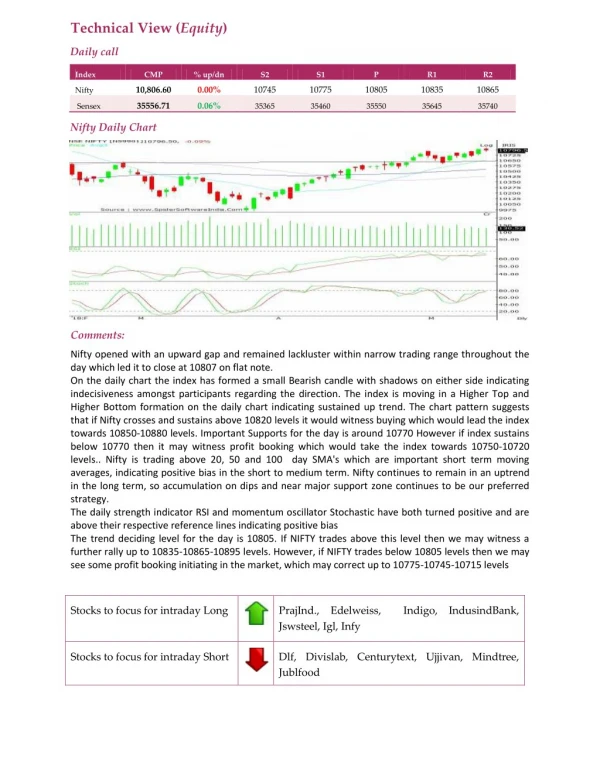
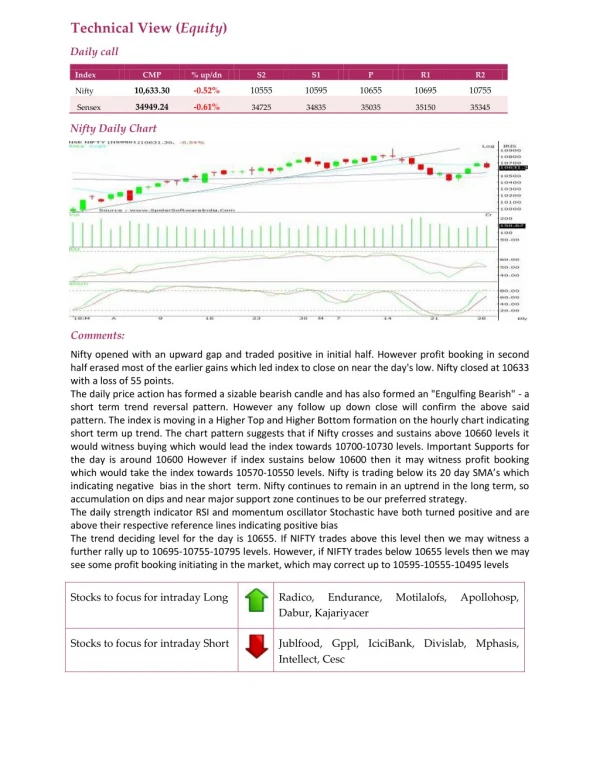
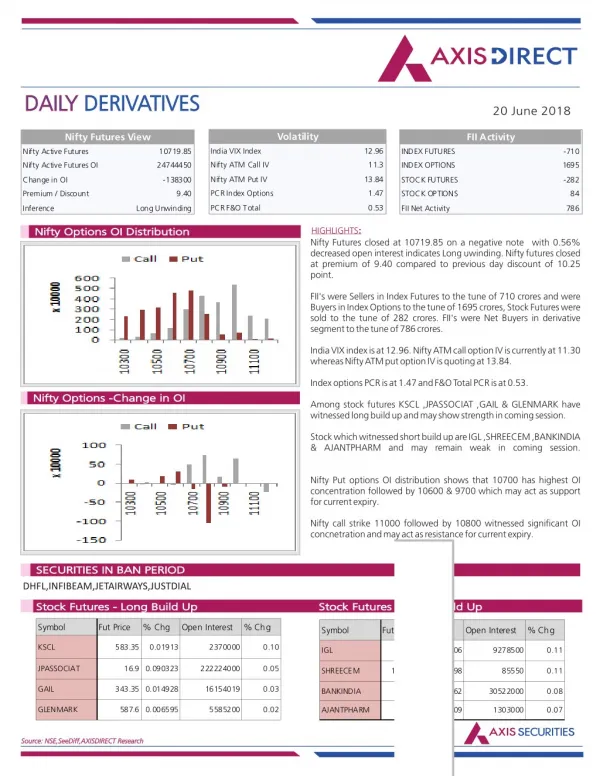
Technical View (Equity) Daily call Index CMP % up/dn S2 S1 P R1 R2 11,389.45 0.02% 11325 11355 11395 11425 11460 Nifty 37665.8 -0.07% Sensex 37420 37545 37710 37835 38000 Nifty Daily Chart Comments: Nifty opened with an upward gap and remained lacklustre within narrow trading range throughout the day. Nifty closed at 11389 with a gain of 2 points. On the daily chart the index has formed a Bearish candle with lower shadow indicating buying support at lower levels. Nifty is forming high of around 11430 levels from the last two days indicating resistance at this level. Once it crosses this level, further upside movement can be expected. The index is moving in a Higher Top and Higher Bottom formation on the daily chart indicating sustained up trend. The chart pattern suggests that if Nifty crosses and sustains above 11400 levels it would witness buying which would lead the index towards 11430-11460 levels. Important Supports for the day is around 11370 levels. However if index sustains below 11370 levels then it may witness profit booking which would take the index towards 11340-11300 levels. Nifty is trading above 20, 50 and 100 day SMAs which are important short term moving averages, indicating positive bias in the short to medium term. Nifty continues to remain in an uptrend in the short and medium term, so buying on dips continues to be our preferred strategy. The daily strength indicator RSI is marginally above its reference line and momentum oscillator Stochastic has turned positive and is above its reference lines indicating positive bias. The trend deciding level for the day is 11395. If NIFTY trades above this level then we may witness a further rally up to 11425-11460-11495 levels. However, if NIFTY trades below 11395 levels then we may see some profit booking initiating in the market, which may correct up to 11355-11325-11285 levels Stocks to focus for intraday Long Ntpc, Tatasteel, Bataindia, Chennpetro, Dbcorp, Exideind Stocks to focus for intraday Short Bpcl, Cipla, Coalindia, Sunpharma, Techm, Bankbaroda