Boxplots
Boxplots. Why use boxplots?. ease of construction convenient handling of outliers construction is not subjective (like histograms) Used with medium or large size data sets (n > 10) useful for comparative displays. Disadvantage of boxplots. does not retain the individual observations


Boxplots
E N D
Presentation Transcript
Why use boxplots? ease of construction convenient handling of outliers construction is not subjective (like histograms) Used with medium or large size data sets (n > 10) useful for comparative displays
Disadvantage of boxplots does not retain the individual observations should not be used with small data sets (n < 10)
Five-number Summary • Min – Minimum observation • Q1 – median of observations to left of overall median • M- median of the entire set • Q3 – median of observations to right of overall median • Max – maximum observation
Five-number Summary Example Data set: • 19 24 25 25 33 33 34 34 37 37 40 42 46 49 73 Min Q1 M Q2 Max
How to construct find five-number summary Min Q1 Med Q3 Max draw box from Q1 to Q3 draw median as center line in the box extend whiskers to min & max
Modified boxplots display outliers whiskers extend to largest (smallest) data value insidethefence ALWAYS use modified boxplots in this class!!!
Inner fence Interquartile Range (IQR) – is the range (length) of the box Q3 - Q1 Q1 – 1.5IQR Q3 + 1.5IQR Any observation outside this fence is an outlier! Put a dot for the outliers.
Modified Boxplot . . . Draw the “whisker” from the quartiles to the observation that is within the fence!
A report from the U.S. Department of Justice gave the following percent increase in federal prison populations in 20 northeastern & mid-western states in 1999. 5.9 1.3 5.0 5.9 4.5 5.6 4.1 6.3 4.8 6.9 4.5 3.5 7.2 6.4 5.5 5.3 8.0 4.4 7.2 3.2 Create a modified boxplot. Describe the distribution. Use the calculator to create a modified boxplot. (Page 46)
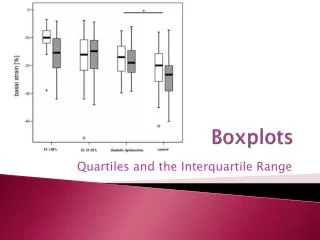
Evidence suggests that a high indoor radon concentration might be linked to the development of childhood cancers. The data that follows is the radon concentration in two different samples of houses. The first sample consisted of houses in which a child was diagnosed with cancer. Houses in the second sample had no recorded cases of childhood cancer. (see data on note page) Create parallel boxplots. Compare the distributions.
Cancer No Cancer 100 200 Radon The median radon concentration for the no cancer group is lower than the median for the cancer group. The range of the cancer group is larger than the range for the no cancer group. Both distributions are skewed right. The cancer group has outliers at 39, 45, 57, and 210. The no cancer group has outliers at 55 and 85.