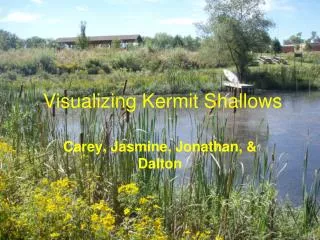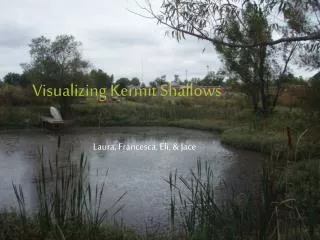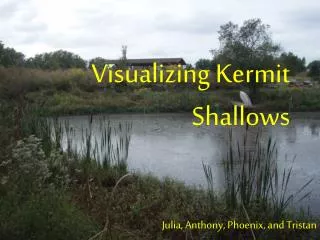
Visualizing Kermit Shallows
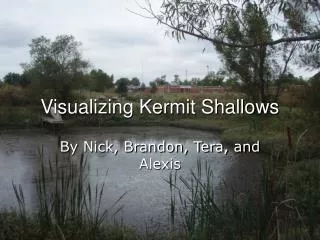
Visualizing Kermit Shallows. By Nick, Brandon, Tera, and Alexis. Pond Definitions and Parts.

Visualizing Kermit Shallows
E N D
Presentation Transcript
Visualizing Kermit Shallows By Nick, Brandon, Tera, and Alexis
Pond Definitions and Parts Limnology: The study of inland waters- ponds, lakes, and streams. It is a division of the larger branch of science called ecology which deals with the way plants and animals live together in a particular environment. Pond: A quiet body of water so shallow that rooted plants grow completely across it. The Littoral Habitat: The area that extends from the water’s edge outward as far as rooted plants grow. Emergent Plant Zone: The area of the pond that is closest to the shore. It is dominated by plants that are rooted to the bottom and have stems and leaves above the surface. Many kinds of frogs, birds, and mammals find food and shelter in the emergent plant zone. Floating Leaf Plant Zone: This area is characterized by broad, flat-leaved water lilies and such floating plants as water ferns and duckweeds. Because the floating leaves shade out the light, bottom plants can be scarce. Some snails, bugs and mayflies lay their eggs on the underside of leaves.
Pond Definitions and Parts ctd. Submersed Plant Zone: This area is the innermost band of vegetation. Pondweeds, hornworts, and waterweeds are typical here. All have leaves that are either long and sinuous or bushy and branched. The flowers are pollinated above the surface, and they grow completely submerged. No Rooted Plants: Plants with no roots grow in this area.
Gathering Data • 1. A transit line was put around the pond starting at the northwest corner and leveled using bubble levels. • 2. Stakes were put every 5 m around the pond. • 3. Flags were placed on each stake so that they could be found.
Gathering Data • 4. Starting at the northwest corner, a string with flags at every 5 m was run across the pond. The first 5 meter flag on the string was placed on the stake on the north side and brought down level with the transit string. The string was leveled on the south side of the pond using a bubble level above the corresponding stake. The string was kept tight.
Gathering Data • 5. Measurements were taken at each flag on the string using a 2.4 m pole that had been marked off in .5 dm units. Measures above dry soil were given positive values (+) and measurements below water level were given negative values (-). • 6. Measures were taken for all 15 stakes on the north and south side.
Gathering Data (Click to view the video.)
Filtering Data In this data only 13 stakes were used, the 14th and 15th stakes on each side were added in as 0 values as can be seen on the next slide.
Visualizing Using Excel, Easy-Viz, and Gnuplot • This is our Gnuplot visualization. It shows the general shape of the pond. Colors that are yellow and orange are higher up. Darker colors like purple are lower.
Visualizing Using Excel, Easy-Viz, and Gnuplot • This is our Easy-Viz visualization it shows us the pond from above. In this visualization the red areas are the highest and the blue areas are deeper.
Visualizing Using Excel, Easy-Viz, and Gnuplot • This is our excel colored contour plot. It shows the pond in three dimensions with colors to represent the various depths.
Visualizing Using Excel, Easy-Viz, and Gnuplot • This is our excel. Wired contour plot. It shows the pond in three dimensions with wire frames.
Visualizing Using Excel, Easy-Viz, and Gnuplot • This is our excel colored contour. It shows the pond on a flat grid from an above view. It has colors to represent depths.
Visualizing Using Excel, Easy-Viz, and Gnuplot • This is our excel wired contour. It shows the pond in two dimensions. It uses wires.
What do the Visualizations tell us about our pond? • In our pond, the deepest spot is on the east side near the dam. It is about -1.00 to -2.00 meters deep. In general, the dam side is deeper than the west side. The shape of the pond is a triangle, and the dam side forms the most clear line. The others are not man made, and are more jagged.
Reference List • gnuplot download (version 4.4). Retrieve August 23, 2010, from • http://sourceforge.net/projects/gnuplot/files/ • Microsoft Excel. (2003). Microsoft. • NCSA Visualization Suite. Retrieved August 23, 2010, from • http://education.ncsa.illinois.edu/resources/software_tools/vizsuite.html • Reid, G. K. (2001). Pond Life. New York, NY: St. Martin’s Press.