Download
1 / 13
130 likes | 227 Views
Understand how V-diagrams and shift curves help in analyzing channel control and section control measurements. Learn how to apply shifts accurately based on stages and time. See a practical example for effective shift application.

E N D
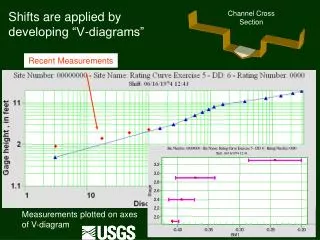
Channel Cross Section Shifts are applied by developing “V-diagrams” Recent Measurements Measurements plotted on axes of V-diagram
Channel Cross Section Here is what a v-diagram and its shift curve generally look like Shift curve Variable shift diagram
Shifts vary by STAGE and TIME Sept. 1 July 1
Shifts should be faithful to the base rating Meas. made 7/20 and 8/15 Sept. 1 July 1
Let’s follow an application of shifts at a site Recent Measurements Concrete Control
It would be easy (but WRONG) to lump all measurements into one shift---- 4 5 6 3 2 1 4 6 3 5 2 1
One shift doesn’t always work Channel Control Section Control
Let’s see how all the available information should be put together Algae growth? Channel Control Section Control
Changes in the channelcontrol caused the rating to shift Upstream view of control at GH of 5.40 feet Channel Control Downstream view of control at GH of 6.25 feet
Measurements were used to define two shift curves V-diagram representing channel control 4 V-diagram representing section control 5 6 3 2 1
Shift application took the hydrograph into account Effective from ???? Effective from ???
Hold Scour Fill Here is a generalized example of how shifts can be timed Prorate X #3 #2 X #1 X X=Discharge Measurement