Download
1 / 31
320 likes | 474 Views
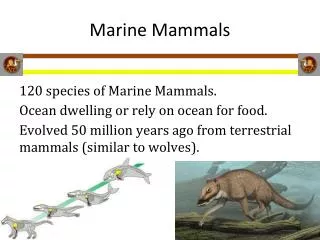
A new look at the interactions between marine mammals and fisheries (or did we we mess up the North Atlantic, and now blame them for what we did?). Daniel Pauly Fisheries Centre University of British Columbia Vancouver, Canada. United Nations University Fisheries Training Programme

E N D
A new look at the interactions between marine mammals and fisheries (or did we we mess up the North Atlantic, and now blame them for what we did?) Daniel Pauly Fisheries Centre University of British Columbia Vancouver, Canada United Nations University Fisheries Training Programme Institute of Marine Research, Reykjavik, Iceland, December 18, 2002
For example, virtually all species at or neat the top of North Atlantic food webs have been depleted by excess fishing, as illustrated here by trends in biomass (blue) and fishing mortality (red) from single-species assessments. Trends from R.M. Myers’ online database http://www.mscs.dal.ca/~myers/welcome.html
Iceland is no exception, as illustrated here by the trend in cod biomass… Figure courtesy of Hreidar Thor Valtysson, University of Akureyri
To generalize these results, we defined small spatial cells, which can be mixed and matched as needed. We chose ½ lat./long cells (of which there are about 260,000 in the world ocean, and 20,000 in the North Atlantic).
Then we used a ruled-based algorithm… Taxon (what) Country (who) FAO Area (where) Taxon distribution database Fishing access database Spatial reference database This routine now assigns over 99 % of FAO global marine catches to ½ degree spatial cells, and we are still improving the underlying databases … Common spatial cells? NO Improve databases YES Assign catch rate to common cells
Here is an example of a map thus generated using catch data from 1900 and about… (t/km2year-1) (t/km2year-1 Catch of table fish in 1900 (fishes with trophic level > 3.75) (map by R. Watson, SAUP)
Which can be compared with data from 100 years later… Catch of table fish in 1999 (R. Watson, SAUP)
That we can see little difference is not surprising, given the evolution of catches in the North Atlantic…
Now to the ecological processes underlying all of this. As we know, fisheries exploit resources embedded within food webs… wherein each organism has its own trophic level …
Marine Freshwater Thus, we can estimate (from catch data and the trophic level of all species caught) the mean trophic level of global fisheries landings. This is declining… Pauly et al. Science March 1998
This process, wherein fisheries catches are increasingly based on organisms low in the food web, now known as ‘fishing down marine food webs,’ is particularly strong in the North Atlantic… Northwest Atlantic Northeast Atlantic Pauly et al. Science (1998); CJFAS (2000); etc…
This can be verified for Iceland, thanks to an excellent catch database assembled by Hreidar Valtysson, of Akureyri University… Available from the author, or online at www.saup.fisheries.ubc.ca)
This process is very strong in Icelandic waters... Figure courtesy of Hreidar Thor Valtysson, University of Akureyri
The impact of ‘fishing down’ on marine ecosystems in huge, as illustrated here by food web models from two data-rich food areas. In these pyramids, the volume at each trophic level indicates the amount of biological production…. Note that the corresponding pyramids for 2002 would be about half the size of those for the 1980s…)
We used 23 Ecopath models to generalize these values to the entire North Atlantic: Data • The approach is: • based on ecosystem models (23 models representing 15 areas) to supply information over time and space. • based on a ½ degree latitude by ½ degree longitude grid system; • We then: • Predict biomasses from multiple linear regression stratified over the North Atlantic area. Analysis Results Discussion
(t/km2) Biomass of table fish in 1900 (map: V. Christensen, SAUP)
Biomass of table fish in 1999 (map: V. Christensen, SAUP)
The squashed down food pyramids shown earlier imply shorter food chains…
The shorter food webs, and the reduced biomass imply, ironically, a greater susceptibility to environmental fluctuations (Pauly et al., Nature, Nov. 2002)
We now turn to the marine mammals Biomass (millions of metric tonnes) One fact for starters: there are less of them now than before.
And hence their food consumption is less than before… Consumption or catch (millions of metric tonnes/year) ..even though they still do consume more than we catch in total.
But these gross number are not very informative, and we thus applied our mapping approach to marine mammals, as well. The source of the marine mammal distributions...
One first result is here: the distribution of marine mammal food consumption in the 1990s. [Note that, presently, our model does not include seasonal migrations, and is thus likely to underestimate feeding rates in the Northern North Atlantic, and conversely for the Southern North Atlantic. Correcting for this will likely add to food consumption around, e.g., Iceland
The key equation is here. It defines an overlap index that accounts for both the diet (or catch) composition of the 60 + species involved (and all fisheries), and the respective amounts taken. This is the index that we mapped…
The feeding overlap between the fisheries and marine mammals can also be shown by groups:
There is a better ways to look at whales and other marine mammals, anyways: Cited from: ‘In a Perfect Ocean’ (Island Press, 2003; D. Pauly and J. Maclean)
In conclusion: the problem of fisheries, in the North Atlantic cannot be resolve by killing more wildlife. Rather, we must deal with the root cause, illustrated by this map, where areas with no fishing whatsoever are shown ingreen …
Acknowledgements… • Thanks to the Pew Charitable Trusts, Philadelphia; • Fisheries Centre, Faculty of Graduate Studies, UBC; • Members of the Sea Around Us project; and many others.