Download
1 / 45
450 likes | 591 Views
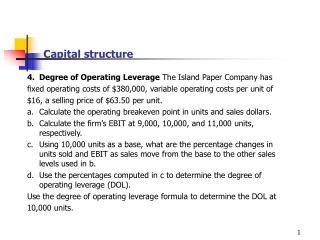
CPO West Conference Capital Structure Session. January 4th, 2005April 27, 2007 San Diego, CA. January 4th, 2005. January 4th, 2005. Agenda. Program Overview Cost of Capital – Big Picture Cost of Equity for Public Firms Cost of Equity for Private Firms Discount for lack of marketability

E N D
CPO West ConferenceCapital Structure Session January 4th, 2005April 27, 2007 San Diego, CA January 4th, 2005 January 4th, 2005
Agenda • Program Overview • Cost of Capital – Big Picture • Cost of Equity for Public Firms • Cost of Equity for Private Firms • Discount for lack of marketability • Cost of debt • Cost of capital calculation • Optimal structure discussion
Spectrum of Financing Alternatives Senior Secured Subordinated / Equity-Linked Equity Equity Products Traditional Bank Debt Institutional Term Loan Private Placement 2nd Lien Term Loan High Yield Mezzanine Debt Convertible Debt Flexibility • Maintenance covenants required • Always pre-payable (usually at par) • Allows for frequent modifications (covenants, acquisitions, etc.) • Maintenance covenants (outside of bank debt) • Pre-payment premiums • Less flexibility than subordinated debt • Debt incurrence covenant (Mezz debt includes maintenance covenants) • Provides more flexibility than all senior structure • No call period • Pre-payment premiums • Dilutive to EPS • May not be attractive at current stock price Cost Lowest Issuance and Borrowing Costs Increased Issuance and Borrowing Costs • Highest Issuance and Borrowing Costs (can include a PIK component) • Convertible Debt will carry a lower interest cost in exchange for optionality OtherConsiderations Lenders look for ancillary business opportunities; security basedcredit quality Typically requires a rating and is always secured Fixed rate placement requires make-whole premium Need to understand investor rationale Requires a rating; typically unsecured or second priority High fixedborrowingcosts Potentially dilutive Balancing the Competing Factors of Flexibility & Costs
Fundamentals on Capital Structure Capital Structure Pyramid Lower Cost To Lender/Investor: To Company: Lower Risk Higher Financial Risk Senior Debt Subordinated Debt, High Yield, Mezzanine, Converts Equity Lower Financial Risk Higher Risk Higher Cost
Fundamentals on Capital Structure Cost & Flexibility Chart Highest Cost Lowest Cost Least Flexible Most Flexible Some Advantages: • Story deal OK • Future flexibility • Future flexibility • Liquidity • Potential higher valuation • Could be lowest cost depending on tax situation • No/few covenants • Minimal amortization • Lowest cost • No dilution • Relatively low cost • No covenants • No Amortization • Complex stories OK • No external reliance or limits Some Disadvantages: • Highest cost • Size required • Covenants • Maybe equity kicker • Highest cost • Size required • Limited by amount of leasable assets • Restrictive covenants • Maximum amortization • Leverage increases ROE
Capital Sourcing Alternatives Financing Alternatives at Various Stages of the Corporate Life Cycle 30 Rejuvenation Stagnation 25 Decline 20 Sales ($ Millions) 15 10 5 0 R&D Start-Up Growth Maturity Uncertain Individual Investors Venture Capital Private Equity Funds Strategic Alliances Asset-Based Working Capital Lines Internally Generated Cash Flow Mezz./Subord. Debt Long -Term Debt (Cash Flow) Public Equity
Capital Sourcing Alternatives Line of Credit / Revolver Short term financing • Trade gap • Least expensive financing • Discretionary
Capital Sourcing Alternatives SeniorSecured Asset Based • Least expensive form of financing • after revolver and possibly lease • - Interest rate typically based • upon “spread” plus “prime, • LIBOR, CP…” but can have a • fixed rate option • Benefit of tax deductibility of • interest payments • Principal repayments are a drain on • cash flow and earnings • Claims take priority over all other • debt financings
Capital Sourcing Alternatives SeniorUnsecured Cash Flow Based • Manage by very specific • performance standards/covenants • Place strong emphasis on • historical cash flow • Less ideal for a company planning • rapid growth or for a company • that cannot predict future with • great certainty.
Capital Sourcing Alternatives SeniorUnsecured - Cash Flow Based Suitability: Borrower Profile When Appropriate • Strong cash flows • Long Operating History • Low risk profile • Available capacity • Long term needs • Attractive fixed rates
Capital Sourcing Alternatives Senior Lender Underwriting Considerations (Line of Credit, Revolver, Senior Secured, Senior Unsecured) • Financial performance (historical) • Cash flow analysis and coverage • Ratio analysis • Future cash flow sustainability • Projections; level of growth; improvements rationale • Niche • Industry characteristics/fundamentals • Management resumes/background • Company/competitive standing
Capital Sourcing Alternatives Mezzanine/Subordinated Debt • Lower creditor priority to senior • debt, but higher than equity • Higher risk debt, therefore more • expensive • - Fixed or variable rate • - Equity kicker, usually warrants • Various forms: • - subordinated debt • - subordinate debt with kicker • - convertible debenture
Capital Sourcing Alternatives Mezzanine/Subordinated Debt Suitability: Borrower Profile When Appropriate • Stable cash flow • Growth prospects • Operating History • Strong management • Non-cyclical, low/medium- • technology • Limited senior debt capacity • Medium term needs (5-10 years) • Reluctance to give up much equity
Capital Sourcing Alternatives Preferred Equity • Hybrid of pure equity and debt • financing • - Fixed dividend to investor (Cash or Paid-in-kind) • - Capital appreciation • Senior priority to common stock • Often convertible to common stock • Dividend payment not tax • deductible to issuing company • Unless convertible, preferred holders don’t participate in equity appreciation
Capital Sourcing Alternatives Common Equity • Most expensive form of financing • Drawbacks include: • - Non-tax deductibility of • dividend payments • - Loss of corporate control • - Dilution of ownership in • further issuance • - High issuance costs (public)
Capital Sourcing Alternatives Common Equity - Majority Interest Suitability: Borrower Profile When appropriate • Strong management • Strong growth potential • Little operating history • Clear exit strategy (for private • placements) • - IPO • - Private Sale • - Recapitalization • Flexibility needed and/or can’t support • current debt payments • Willing to share ownership / control • Benefit of partner • High growth - all cash flow needs to • be reinvested • High R&D requirements • Acquisition funding
Capital Sourcing Alternatives Common Equity - Minority Interest Terms and Description • Take out 2-5 year investment horizon • Required return of approximately low 20s% • Defined exit • Usually preferred stock or separate class of common stock • New investors have voice, not control Borrower Profile When appropriate • Strong management • Strong growth potential • Some operating history • Don’t want change in control • Growth / Recapitalization / Deleverage • Flexibility needed or lack of senior or • mezzanine debt available • Pre-IPO or shareholder liquidity vehicle
Capital Sourcing Alternatives Equity & Equity-Like Investor Underwriting Considerations (Subordinated Debt, Preferred Equity, Common Equity - Majority/Minority) • Valuation comparables • Industry characteristics • Management resumes/background • Company/competitive standing/advantages • Historical & projected growth rate • Financial performance (projected) • EBITDA, Free Cash Flow and Net Income growth • Exit strategy: IPO or Private Sale • Refinance with new sub-debt or preferred • Current and Potential size of the company’s market
Capital Sourcing Alternatives Other Instruments • Off Balance Sheet Financing: Equipment Leases • Potential tax advantages • Makes balance sheet “cleaner” if not capitalized • Requires security collateral • Sale Leaseback of Real Estate; Land and/or Building • Type of property (office, industrial, commercial, etc.) • Securitization of Receivables • Available to large companies with strong customer base
Prudent Capital Structure with Financial Flexibility • Value of a Firm = Present Value of Cash Flows to the Firm, discounted back at the cost of capital. • You need to optimize the value of the firm by minimizing capital costs while maintaining both ample free cash flow and financial flexibility. • A survey of Chief Financial Officers of large U.S. companies provided the following ranking (from most important to least important) for the factors that they considered important in the financing decisions • Factor Ranking (0-5) • 1. Maintain financial flexibility 4.55 • 2. Ensure long-term survival 4.55 • 3. Maintain Predictable Source of Funds 4.05 • 4. Maximize Stock Price 3.99 • 5. Maintain financial independence 3.88 • 6. Maintain high debt rating 3.56 • 7. Maintain comparability with peer group 2.47
Measuring Cost of Capital • It will depend upon: • (a) the components of financing: Various tranches of debt, Equity or Preferred stock • (b) the cost of each component • In summary, the cost of capital is the cost of each component weighted by its relative market value. WACC = ke (E/(D+E)) + kd (D/(D+E)) WACC = weighted average cost of capital ke = cost of equity (obtained with CAPM) kd = cost of debt (or weighted average cost of debt) E = market value of equity (market cap) D = market value of debt (theoretically), book debt (practically)
Cost of Equity for Public Firms Dividend yields are lower than interest rates…so equity is cheaper…right?
Cost of Equity for Public Firms • The cost of equity should be higher for riskier investments and lower for safer investments • While risk is usually defined in terms of the variance of actual returns around an expected return, risk and return models in finance assume that the risk that should be rewarded (and thus built into the discount rate) in valuation should be the risk perceived by the marginal investor in the investment • Most risk and return models in finance also assume that the marginal investor is well diversified, and that the only risk that he or she perceives in an investment is risk that cannot be diversified away (i.e, market or non-diversifiable risk)
The Cost of Equity: Capital Asset Pricing Model Model Expected Return CAPM E(R) = Rf + (Rm- Rf) where: CAPM = capital asset pricing model E(R) = expected, or required, rate of return for the equity Rf = risk-free rate (10-year Treasury) b = beta relative to market portfolio Rm- Rf = expected return on the market – risk-free or market risk premium
The CAPM: Cost of Equity • Feedback that I’ve heard regarding CAPM: • Come on…how can this stuff be relevant for my clients? • If I show this to my clients, their eyes will glaze over. • Does your client care about the value of his/her firm? $10 million FCFE, 4% growth assumption
Key Factors that Influence Betas Higher beta High Proportion of Fixed Costs Highly Leveraged • Discretionary products and services • Cyclical • Small firms/growth firms • High priced goods • Stable products or services • Non-cyclical • Large firms • Mature/stable • Low priced goods Nature of company and product or service Financial Leverage Operating Leverage Zero or Low Amount of Leverage Low Proportion of Fixed Costs Lower beta
Cost of Equity for Private Firms • My clients don’t trade publicly. All of their firm’s capital comes from their own pocket. So this stuff doesn’t apply to my clients, does it? • If your clients’ money wasn’t working in their businesses, what could they do with it? • Even if the firm is solely capitalized by owners’ capital, there is a cost of capital. At the least we would expect to see some form of opportunity cost applies to this capital. A better approach is to calculate the firm’s cost of equity as if it were a publicly traded entity and then make adjustments for lack of marketability (illiquidity discount).
Cost of Equity for Private Firm - Motivations • You will need to determine enterprise value for a private company for • Legal purposes: Estate tax and divorce court • Sale or prospective sale to another individual or private entity. • Sale of one partner’s interest to another • Sale to a publicly traded firm • As prelude to setting offering price in an initial public offering • You can also use this approach to value a division or divisions of a publicly traded firm • As prelude to a spin off • For sale to another entity • To do a sum-of-the-parts valuation to determine whether a firm will be worth more broken up or if it is being efficiently run.
A private firm’s true cost of equity……? • The beta of a firm measures only market risk, and is based upon the assumption that the investor in the business is well diversified. Given that private firm owners often have all or the bulk of their wealth invested in the private business, would you expect their perceived costs of equity to be higher or lower than the costs of equity from using betas? • …is higher than that calculated using beta. • …is lower than that calculated using beta.
Valuation Motives and the Next Step in Private Company Valuation: Control and Illiquidity • If valuing a private business for sale (in whole or part) to another individual (to stay private), it is necessary that we estimate • a illiquidity discount associated with the fact that private businesses cannot be easily bought and sold • a control premium (if more than 50% of the business is being sold) • If valuing a business for taking public, it is necessary to estimate • the effects of creating different classes of shares in the initial public offer • the effects of options or warrants on the issuance price per share • If valuing a business for sale (in whole or part) to a publicly traded firm, there should be no illiquidity discount, because stock in the parent firm will trade but there may, however, be a premium associated with the publicly traded firm being able to take better advantage of the private firm’s strengths
Conventional Practice on Illiquidity • In private company valuation, illiquidity is a constant theme that analysts talk about. • All the talk, though, seems to lead to a rule of thumb. The illiquidity discount for a private firm is between 20-30% and does not vary across private firms.
Key Factors that Influence the Amount of the Illiquidity Discount Higher illiquidity discount Not large Less Liquid Small Troubled Type of assets owned by firm Cash flow generating capacity Health of the firm Size of the firm Large More liquid Healthy Large Lower illiquidity discount
Empirical Evidence on Illiquidity Discounts • Illiquidity discounts are typically in the 25%-35% range for most transactions. (See appendix for more information on studies of restricted securities)
Estimating the Cost of Debt • The cost of debt is the rate at which you can borrow at currently. • It will reflect not only your default risk but also the level of interest rates in the market. • The most widely used approach to estimating cost of debt is: • Take the weighted average coupon on book value of debt for existing cost of debt and to look to current market factors to determine appropriate spread for new debt.
Hypothetical Illustration of WACC and Debt Ratios Optimal Level Evolves with the Market
Hypothetical Illustration of a Capital Structure’s Impact on Enterprise Value • The illustration below shows four capital structures for a firm with $20 million EBITDA • Capital structure A = equity capital with cost of 20%. • Capital structure B = same as 1, + $20mm revolver at L+200 + $40mm TL A at L+250 • Capital structure C = same as 2, +$20mm TL B at L+300 • Capital structure D = reduce TL B by $10mm + $25mm mezz at 12% cash, 2% PIK
Hypothetical Illustration of Enterprise Value with Varying Capital Structure: Note Sub-Optimal Opportunity Costs
Recapping the Cost of Capital In summary, the cost of capital is the cost of each component weighted by its relative market value. WACC = ke [E/(D+E)] + kd [D/(D+E)] where: WACC = weighted average cost of capital ke = cost of equity (capital asset pricing model) kd = cost of debt D = weight of debt E = weight of equity
Appendix • Equity Betas and Leverage • Empirical Experience on Illiquidity Discount: Restricted Shares • Estimating a Beta for the NY Yankees • Estimating a Beta for InfoSoft – A Private Firm • Links to articles on Cost of Capital and Excel calculators
Equity Betas and Leverage • Conventional approach: If we assume that debt carries no market risk (has a beta of zero), the beta of equity alone can be written as a function of the unlevered beta and the debt-equity ratio L = u [1+ [(1-t)D/E]] In some versions, the tax effect is ignored and there is no (1-t) in the equation.
Empirical Evidence on Illiquidity Discounts: Restricted Stock • Restricted securities are securities issued by a company, but not registered with the SEC, that can be sold through private placements to investors, but cannot be resold in the open market for a two-year holding period, and limited amounts can be sold after that. Restricted securities trade at significant discounts on publicly traded shares in the same company. • Maher examined restricted stock purchases made by four mutual funds in the period 1969-73 and concluded that they traded an average discount of 35.43% on publicly traded stock in the same companies. • Moroney reported a mean discount of 35% for acquisitions of 146 restricted stock issues by 10 investment companies, using data from 1970. • In a recent study of this phenomenon, Silber finds that the median discount for restricted stock is 33.75%.
Estimating a Beta for the NY Yankees • You have three choices for comparable firms: • Firms that derive a significant portion of their revenues from baseball (Traded baseball teams, baseball cards & memorabilia…) • Firms that derive a significant portion of their revenues from sports • Firms that derive a significant portion of their revenues from entertainment. Comparable firms Levered Beta Unlevered Beta Baseball firms (2) 0.70 0.64 Sports firms (22) 0.98 0.90 Entertainment firms (91) 0.87 0.79 Management target • Levered Beta for Yankees = 0.90 ( 1 + (1-.4) (.25)) = 1.04 • Cost of Equity = 6% + 1.04 (4%) = 10.16%
Estimating a beta for InfoSoft: A private software firm • Comparable firms include all software firms, with market capitalization of less than $ 500 million. • The average beta for these firms is 1.29 and the average debt to equity ratio for these firms is 7.09%. With a 35% tax rate, this yields an unlevered beta of: Unlevered Beta = 1.29/ (1 + (1-.35) (.0709)) = 1.24 • We will assume that InfoSoft will have a debt to equity ratio comparable to the average for the comparable firms and a similar tax rate, which results in a levered beta of 1.29. • Cost of Equity = 6.00% + 1.29 (4%) = 11.16%