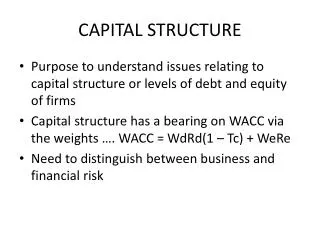
Capital Structure
Capital Structure. 15.1 The Capital-Structure Question and The Pie Theory 15.2 Maximizing Firm Value versus Maximizing Stockholder Interests 15.3 Financial Leverage and Firm Value: An Example 15.4 Modigliani and Miller: Proposition II (No Taxes) 15.5 Taxes 15.6 Summary and Conclusions.

Capital Structure
E N D
Presentation Transcript
Capital Structure 15.1 The Capital-Structure Question and The Pie Theory 15.2 Maximizing Firm Value versus Maximizing Stockholder Interests 15.3 Financial Leverage and Firm Value: An Example 15.4 Modigliani and Miller: Proposition II (No Taxes) 15.5 Taxes 15.6 Summary and Conclusions
The Capital-Structure Question and The Pie Theory • The value of a firm is defined to be the sum of the value of the firm’s debt and the firm’s equity. • V =B + S • If the goal of the management of the firm is to make the firm as valuable as possible, the the firm should pick the debt-equity ratio that makes the pie as big as possible. S B Value of the Firm
The Capital-Structure Question There are really two important questions: • Why should the stockholders care about maximizing firm value? Perhaps they should be interested in strategies that maximize shareholder value. • What is the ratio of debt-to-equity that maximizes the shareholder’s value? As it turns out, changes in capital structure benefit the stockholders if and only if the value of the firm increases.
Financial Leverage, EPS, and ROE Consider an all-equity firm that is considering going into debt. (Maybe some of the original shareholders want to cash out.) Current Assets $20,000 Debt $0 Equity $20,000 Debt/Equity ratio 0.00 Interest rate n/a Shares outstanding 400 Share price $50 Proposed $20,000 $8,000 $12,000 2/3 8% 240 $50
EPS and ROE Under Current Capital Structure Recession Expected Expansion EBIT $1,000 $2,000 $3,000 Interest 0 0 0 Net income $1,000 $2,000 $3,000 EPS $2.50 $5.00 $7.50 ROA 5% 10% 15% ROE 5% 10% 15% Current Shares Outstanding = 400 shares
EPS and ROE Under Proposed Capital Structure Recession Expected Expansion EBIT $1,000 $2,000 $3,000 Interest 640 640 640 Net income $360 $1,360 $2,360 EPS $1.50 $5.67 $9.83 ROA 5% 10% 15% ROE 3% 11% 20% Proposed Shares Outstanding = 240 shares
EPS and ROE Under Both Capital Structures All-Equity Recession Expected Expansion EBIT $1,000 $2,000 $3,000 Interest 0 0 0 Net income $1,000 $2,000 $3,000 EPS $2.50 $5.00 $7.50 ROA 5% 10% 15% ROE 5% 10% 15% Current Shares Outstanding = 400 shares Levered Recession Expected Expansion EBIT $1,000 $2,000 $3,000 Interest 640 640 640 Net income $360 $1,360 $2,360 EPS $1.50 $5.67 $9.83 ROA 5% 10% 15% ROE 3% 11%20% Proposed Shares Outstanding = 240 shares
Financial Leverage and EPS 12.00 Debt 10.00 8.00 No Debt Advantage to debt 6.00 Break-even point EPS 4.00 2.00 0.00 1,000 2,000 3,000 Disadvantage to debt (2.00) EBIT EBI in dollars, no taxes
Assumptions of the Modigliani-Miller Model • Homogeneous Expectations • Homogeneous Business Risk Classes • Perpetual Cash Flows • Perfect Capital Markets: • Perfect competition • Firms and investors can borrow/lend at the same rate • Equal access to all relevant information • No transaction costs • No taxes
Homemade Leverage: An Example Recession Expected Expansion EPS of Unlevered Firm $2.50 $5.00 $7.50 Earnings for 40 shares $100 $200 $300 Less interest on $800 (8%) $64 $64 $64 Net Profits $36 $136 $236 ROE (Net Profits / $1,200) 3% 11% 20% We are buying 40 shares of a $50 stock on margin. We get the same ROE as if we bought into a levered firm. Our personal debt equity ratio is:
Homemade (Un)Leverage: An Example Recession Expected Expansion EPS of Levered Firm $1.50 $5.67 $9.83 Earnings for 24 shares $36 $136 $236 Plus interest on $800 (8%) $64 $64 $64 Net Profits $100 $200 $300 ROE (Net Profits / $2,000) 5% 10% 15% Buying 24 shares of an other-wise identical levered firm along with the some of the firm’s debt gets us to the ROE of the unlevered firm. This is the fundamental insight of M&M
The MM Propositions I & II (No Taxes) • Proposition I • Firm value is not affected by leverage VL = VU • Proposition II • Leverage increases the risk and return to stockholders rs = r0 + (B / SL) (r0 - rB) rB is the interest rate (cost of debt) rs is the return on (levered) equity (cost of equity) r0 is the return on unlevered equity (cost of capital) B is the value of debt SL is the value of levered equity
The Cost of Equity, the Cost of Debt, and the Weighted Average Cost of Capital: MM Proposition II with No Corporate Taxes Cost of capital: r (%) r0 rB rB Debt-to-equity Ratio
Implications of the MM No-Tax Propositions • Capital structure is irrelevant in an MM world without corporate taxes. • VL = VU • The value of the firm (“size of the pie”) is determined by the firm’s capital budgeting decisions. Capital structure determines only how the pie is sliced. • Increasing the extent to which a firm relies on debt increases both the risk and the expected return to equity – but not the price per share.
The MM Propositions I & II (with Corporate Taxes) • Proposition I (with Corporate Taxes) • Firm value increases with leverage VL = VU + TC B • Proposition II (with Corporate Taxes) • Some of the increase in equity risk and return is offset by interest tax shield rS = r0 + (B/S)×(1-TC)×(r0 - rB) rB is the interest rate (cost of debt) rS is the return on equity (cost of equity) r0 is the return on unlevered equity (cost of capital) B is the value of debt S is the value of levered equity
The Effect of Financial Leverage on the Cost of Debt and Equity Capital Cost of capital: r(%) r0 rB Debt-to-equityratio (B/S)
Total Cash Flow to Investors Under Each Capital Structure with Corp. Taxes All-EquityRecession Expected Expansion EBIT $1,000 $2,000 $3,000 Interest 0 0 0 EBT $1,000 $2,000 $3,000 Taxes (Tc = 35% $350 $700 $1,050 Total Cash Flow to S/H $650 $1,300 $1,950 LeveredRecession Expected Expansion EBIT $1,000 $2,000 $3,000 Interest ($800 @ 8% ) 640 640 640 EBT $360 $1,360 $2,360 Taxes (Tc = 35%) $126 $476 $826 Total Cash Flow $234+640 $468+$640 $1,534+$640 (to both S/H & B/H): $874 $1,524 $2,174 EBIT(1-Tc)+TCrBB $650+$242 $1,300+$224 $1,950+$224 $874 $1,524 $2,174
Total Cash Flow to Investors Under Each Capital Structure with Corp. Taxes All-equity firm Levered firm S G S G B The levered firm pays less in taxes than does the all-equity firm. Thus, the sum of the debt plus the equity of the levered firm is greater than the equity of the unlevered firm.
An Example (no taxes): • Imagine you have discovered an investment alternative which produces expected EBIT of $1,000 forever. Similar (unlevered) projects in the market have a required return r0 of 10%. You must put up $5,000 of your own money to invest in this project. • You have two financing alternatives: • Unlevered: you issue yourself $5,000 in equity, SU • Levered: you sell yourself $1,000 debt, B, and $4,000 equity S. The debt pays the market rate rB of 5%.
Example, continued • Annual cash flows, depending on your choice of financing, are: Unlevered Levered EBIT $1,000 $1,000 Interest -50 (rB*B) EBT 1,000 950 Tax (0%) Net Income 1,000 950 CF(B+S) $1,000 $1,000
Example continued, • Proposition I: VU=SU=EBIT/r0 = $1,000/.1=$10,000 VL= B + S = $10,000 S = $10,000 - $1,000 = $9,000
Example, continued • Proposition II: • rS = r0 + (B/S)(r0 - rB ) • r0 = .10 + ($0/$10,000)(.10-.05) = 10% • rS = .10 +($1,000/$9,000)(.10-.05)=10.56% • WACC = (1,000/10,000)(5%) + (9,000/10,000)(10.56%) = 10% = r0
An Example of MM Propositions I & II with Corporate Taxes • Consider the same investment and financing alternatives as for the no tax example, but now TC = 34%, Unlevered Levered EBIT $1,000 $1,000 Interest -50 EBT 1,000 950 Tax(34%) -340 -323 Net Income 660 627 CF(B+S) $660 $677
A Debt versus Equity Problem • The market value of a firm that has $500,000 in debt is $1,700,000. The expected value of EBIT is a perpetuity. The interest rate on debt (pretax) is 10%. The company is subject to a 34% tax rate. If the company were 100% equity financed, the equity holders would have a 20% required return. What is the net income of the firm? What would be the market value of the firm if it were 100% equity financed?
Example Continued • VL=VU + TCB • $1,700 = VU + (.34)*($500) • => VU =$1,530 • VU = EBIT (1- TC )/r0 • $1,530 = EBIT *(1-.34)/.2 • => EBIT = $463, 636
Summary: No Taxes • In a world of no taxes, the value of the firm is unaffected by capital structure. • This is M&M Proposition I: VL = VU • Prop I holds because shareholders can achieve any pattern of payouts they desire with homemade leverage. • In a world of no taxes, M&M Proposition II states that leverage increases the risk and return to stockholders
Summary: Taxes • In a world of taxes, but no bankruptcy costs, the value of the firm increases with leverage. • This is M&M Proposition I: VL = VU + TC B • Prop I holds because shareholders can achieve any pattern of payouts they desire with homemade leverage. • In a world of taxes, M&M Proposition II states that leverage increases the risk and return to stockholders.
Bankruptcy Costs • So far, we have seen M&M suggest that financial leverage does not matter, or imply that taxes cause the optimal financial structure to be 100% debt. • In the real world, most executives do not like a capital structure of 100% debt because that is a state known as “bankruptcy”. • In the next chapter we will introduce the notion of a limit on the use of debt: financial distress. • The important use of this chapter is to get comfortable with “M&M algebra”.